| Issue |
EPJ Photovolt.
Volume 16, 2025
Special Issue on ‘EU PVSEC 2024: State of the Art and Developments in Photovoltaics’, edited by Robert Kenny and Gabriele Eder
|
|
|---|---|---|
| Article Number | 9 | |
| Number of page(s) | 11 | |
| DOI | https://doi.org/10.1051/epjpv/2024052 | |
| Published online | 09 January 2025 | |
https://doi.org/10.1051/epjpv/2024052
Original Article
Investigation of temperature homogeneity during infrared soldering of silicon solar cells using the finite element method
Fraunhofer Institute for Solar Energy Systems ISE, Freiburg, Germany
* e-mail: This email address is being protected from spambots. You need JavaScript enabled to view it.
Received:
26
July
2024
Accepted:
12
December
2024
Published online: 9 January 2025
Abstract
Soldering copper wires to the electrodes of solar cells is a crucial stage in the fabrication of silicon photovoltaic modules. Photovoltaic industries use infrared radiation for soldering because of its high throughput. However, this soldering process could result in an inhomogeneous temperature distribution across the solar cells. Accurately measuring the solar cell temperature during the soldering process within the stringer poses a significant challenge, hindering process optimization to reduce the inhomogeneity. In this study, a finite element model of the infrared soldering process is developed, enabling the computation of the solar cell temperature based on specified electrical power, the duration of radiation from the infrared emitters and the hotplate temperature. This model is versatile and capable of computing the temperature for different solar cell types and sizes by using their radiative and thermal properties, while also considering the shading effects of the down-holder used. The model is validated for different radiation intensities using thermocouples at different positions on the solar cells during the infrared soldering process. The maximum difference between the simulated and measured temperatures is found to be (8 ± 4) K in the peak zone. Thus, a novel and robust finite element model is developed to determine the accurate solar cell temperature during the infrared soldering process.
Key words: Finite element method / infrared soldering / photovoltaic modules / radiative heat transfer / interconnection / solar cells
© D.C. Joseph et al., Published by EDP Sciences, 2025
 This is an Open Access article distributed under the terms of the Creative Commons Attribution License (https://creativecommons.org/licenses/by/4.0), which permits unrestricted use, distribution, and reproduction in any medium, provided the original work is properly cited.
1 Introduction
In the rapidly evolving landscape of photovoltaic (PV) technology, where solar cell types and solder alloys continue to advance, constantly updating the soldering process becomes a challenge. The soldering process is crucial not only for establishing electrical connectivity but also for determining the mechanical stability of PV modules [1]. Silicon solar cells experience thermomechanical stress during the soldering process, especially during the cooling phase [2]. Therefore, precise temperature management of the solar cells during this process is essential to reduce the thermomechanical stress and ensure the reliability of PV modules [3,4]. Stringers are the primary tools used in the photovoltaic industry to perform industrial soldering processes employing infrared (IR) radiation [5]. IR soldering enables rapid, non-contact heating through a reflow soldering process. This process on industrial stringers involves several hotplates beneath the transport band and IR emitters that radiate heat to the solar cells. By controlling the electrical power of the emitters and the duration of radiation, the desired temperature on the solar cell can be achieved. The heat is transferred to the joint and leads to the melting of the pre-positioned solder-coated copper wire [1].
Despite its advantages, the IR soldering process results in an inhomogeneous temperature distribution on the solar cells due to the uneven heat distribution and shading effects of, e.g., the ribbon hold-down device system (down-holder). This inhomogeneity leads to issues such as solar cell overheating, badly or non-contacted joints and increased thermomechanical stress. Addressing this inhomogeneity is crucial for optimizing the soldering process for reliable production of soldered strings to reduce the failure of joints within the PV module. During the IR soldering process, the solar cells typically exhibit a higher temperature at their centers compared to their edges, leading to the solidification of the solder at different times [6]. This is crucial for solar cells where the maximum temperature should be low, as heating the edges above the melting temperature of the solder alloy leads to overheating the center of the solar cells. Further, understanding this inhomogeneous temperature distribution is essential for accurately calculating the thermomechanical stress during the IR soldering process. This insight is crucial for optimizing the process to minimize temperature inhomogeneity, thereby ensuring homogeneous interconnections and high-quality solder joints. However, measuring the exact solar cell temperature during the soldering process within the stringer presents a complex challenge. Therefore, optimizing the IR soldering process to reduce temperature inhomogeneity for different solder alloys and solar cell types remains a tedious task. Previous researches have computed the thermomechanical stress caused by the soldering process in the PV industry using either a homogeneous temperature distribution on solar cells and interconnections or two different temperature profiles for the solar cells and the interconnections, respectively [2,7–9].
The aim of this study is to develop a finite element method (FEM) model functioning as a digital model of the industrial IR soldering process used in PV. This model is designed to compute the temperature distribution on industrial silicon solar cells during the IR soldering process, employing radiative heat transfer. The obtained temperature values are dependent on process parameters: power to the IR emitters PIR, the duration of radiation tIR and the temperature of the hotplates THP, as well as factoring in the shading and reflection effects of the down-holder. The model aims to enhance the accuracy of temperature predictions during the IR soldering process, thereby contributing to the optimization of the soldering procedure. This model is validated with the solar cell temperature measured at different positions using both passivated emitter and rear cells (PERC) and silicon heterojunction (SHJ) half-cells during the IR soldering process in the stringer. Thus, this model is versatile and capable of computing the temperature for various other solar cell sizes and solar cell types, such as TopCon, using their radiative and thermal properties. Consequently, this FEM model not only computes solar cell temperatures but also serves as a tool to identify optimal process parameters and optimize the material and geometry of the down-holder to reduce solar cell temperature inhomogeneity.
2 Materials and methods
2.1 Radiative heat transfer
Radiative heat transfer, also known as thermal radiation, is the transfer of heat in the form of electromagnetic radiation through a medium or vacuum. These radiations occur in the infrared, visible, and ultraviolet parts of the spectrum. Any object with a temperature above absolute zero emits electromagnetic radiation, and this radiation is propagated where it interacts with other objects causing heating. The rate of these incident radiations per unit area is called thermal irradiance. The incident radiation may be absorbed, reflected, or transmitted by the object and can be described as [10]:
 (1)
(1)
where α is absorptivity, ρ is reflectivity and τ is transmissivity. The absorptivity, α, is equal to the emissivity, ε, and for black bodies, α = ε = 1.
Thermal radiation in simplest form, is defined by Stefan-Boltzmann law, which states that the total emissive power E radiated from an object is directly proportional to the fourth power of its absolute temperature T [11]:
 (2)
(2)
where ε is the emissivity of the object with a value 0 ≤ ε ≤ 1 (1 being a black body), σ is called the Stefan-Boltzmann constant with a value σ = 5.670373×10⁻⁸ W/(m2. K4).
The total emissive power for hot object radiating energy to cooler surroundings is given by [11]:
 (3)
(3)
with T2 being the temperature of the hot object and T1 is the temperature of the cooler surrounding.
Max Plank described the spectral emissive power of a blackbody Eλb (T) [12], as a function of surface temperature T, and wavelength λ [12]:
 (4)
(4)
here, n is the refractive index of the radiating surface, h = 6.62606876 × 10⁻³⁴ J.s, is the Planck's constant, Kb = 1.3806503 ×10⁻²³ J/K, c0 is the speed of light. C1 and C2 are the radiation constants with  and C2 = hc0/k0 and Iλb is the radiation intensity. For a gray body with emissivity ε, equation (4) is written as:
 (5)
(5)
Stefan-Boltzmann law for total emissive power for a black body can also be obtained by integrating the Planck's Equation (1) across all wavelengths:
 (6)
(6)
The radiative power over a spectral band is defined by [12]:
 (7)
(7)
where  is the fractional emissive power (FEP) in the wavelength interval λ1 and λ2. It is expressed as:
 (8)
(8)
The radiative heat transfer rate between the surface of body 1 and the surface of body 2 can be written as [10]:
 (9)
(9)
where Q is the amount of radiative heat and F1−2 is the view factor, which is the proportional value of the radiation leaving the surface of body 1 and arriving the surface of body 2. The factor is described as:
 (10)
(10)
here A1 and A2 are the surface area of surfaces 1 and 2 respectively, β1 and β2 are angles between normal vectors to the given surfaces, and r is the distance connecting the points on the surfaces.
2.2 Infrared soldering
Infrared soldering utilizes infrared radiation emitted by IR emitters that operate in the region with a wavelength range of 0.5 to 3 µm, which spans from visible to the infrared region and peak radiation between 1 and 1.5 µm, which is predominantly in short-wave infrared radiation (SWIR) region [13]. In the context of industrial soldering on stringers, this method involves the use of several hotplates positioned below a transport band, combined with IR emitters from above that emit direct infrared radiation onto the solar cells. The solar cells and the interconnecting wires are held in position by the down-holder during the IR soldering process. This configuration ensures the efficient and controlled heating necessary for the soldering process.
Figure 1a sketches schematically the hotplates and two IR heating zones used in a stringer. The temperature ramp-up above the melting point of the solder alloy occurs in the IR zones. The hotplates before the IR heating zones are used to pre-heat the solar cells and the interconnections, while the hotplates after the IR heating zones are used to control the cooling of the soldered solar cells. Each IR zone contains several IR emitters that radiate infrared radiation to heat the solar cells and solder‑coated copper wire (ribbon). An IR emitter in the industrial stringer comprises a quartz halogen tube with an internal tungsten filament. Figure 1b shows a sketch of an IR zone with 4 IR emitters in an industrial stringer along with its reflector. The IR emitters have an efficiency of 90–95 % and exhibit a rapid response to changes in heating [14,15].
The tungsten filament within the emitter is heated by the Joule heating effect, where the amount of heat generated is proportional to the filament's resistance, the duration of electricity flow, and the square of the electric current passing through the filament [16]. Thus, the temperature of the tungsten filament can be regulated using the electric power supplied to the filament (PIR) and the duration of current flow (tIR). By controlling the filament's temperature, the emissive power can be adjusted to achieve the desired heating of the solar cells. These parameters, PIR and tIR, along with the hotplate temperature THP, are used to control the solar cell temperatures and will be referred to as process parameters.
The temperature profile of the IR soldering process can be divided into three stages, as illustrated in Figure 2. This figure exemplarily shows the temperature profile for soldering with Sn60Pb40 solder alloy, which has a solidus temperature of 183 °C and a liquidus temperature of 190 °C. The first stage is the pre-heating phase, where the solar cells are heated up by hotplates. During this stage, the temperature of the solar cells gradually increases, depending on the process speed. The second stage is the IR heating phase, where the solar cells are predominantly heated by the IR emitters. In this region, the temperature is ramped up above the liquidus temperature (190 °C) of the solder alloy, allowing the solder to establish contact between the copper wire and the silver electrode of the solar cell. The final stage is the cooling phase, where the solar cells are cooled to ambient temperature. During this phase, the solder alloy solidifies below 183 °C, forming an electrical and mechanical bond between the solar cells and the copper wire.
 |
Fig. 1 a) Position of the hotplates and the IR zones in an industrial stringer. b) 2D view of an IR zone with 4 IR emitters in the stringer (front view). |
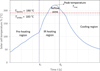 |
Fig. 2 Typical thermal profile during IR soldering with Sn60Pb40 solder alloy. |
2.3 FEM model
The objective of predicting solar cell temperature during the IR soldering process in an industrial stringer is achieved using finite element method (FEM) modeling in COMSOL Multiphysics 6.2. The FEM model consists of a sub-model and a global model. The sub-model encompasses the IR emitters, featuring a simplified representation of the tungsten filament. This sub-model is used to compute the temperature of the tungsten filament (TF) through thermoelectric simulation, incorporating process parameters PIR and tIR. A detailed description of this model is provided in Appendix 1. In the global model, the temperature values TF from the sub-model are utilized to calculate the radiation emitted from the IR emitters. Using these radiation values, the solar cell temperature (TC) is computed through heat transfer in solids and surface-to-surface radiation physics. This process models the radiative heat transfer between the IR emitters and the solar cells with ribbons. The global model of the industrial IR soldering process includes four hotplates, with the IR zone consisting of four IR emitters positioned above hotplate 3, as shown in Figure 3. The normalized spectral emissive power of these IR emitters is illustrated in Figure 4, which serves as input for the FEM model, providing the fractional emissive power at different wavelength ranges as described in Table 1.
In this work, we use M6 PERC and SHJ half solar cells (83 mm × 166 mm) with six busbars (BB) and a down-holder with six metal strips. To reduce computational effort, a symmetry plane is applied perpendicular to the longer side of the solar cell, as illustrated in Figure 5a. The ribbon comprises a 0.32 mm diameter round copper wire attached to the solar cell with Sn60Pb40 solder alloy, as depicted in Figure 5b. The shaded region on the solar cell due to the down-holder during the IR soldering process is shown in Figure 5c. The material properties used for the simulation are summarized in Table 2. For validation, PERC and SHJ half-cells are measured. The emissivity of these solar cells in a temperature range of 140–145 °C from in-situ measurement using an infrared camera and an infrared thermometer is 0.75 and 0.7 for PERC and SHJ solar cells, respectively, which is used in the FEM model as well. In this model, the silicon solar cell and the quartz tube are treated as semi-transparent surfaces, the reflector as an opaque surface, and the filament, Sn60Pb40 solder alloy, copper wire and down-holder as diffuse surfaces. For opaque and diffuse surfaces, the transmissivity τ in Equation (1) is zero, and reflectivity is calculated as ρ = 1 − ε.
The mesh consists of brick elements for the solar cell, down-holder and reflector. Prism elements are used for the round copper wire, Sn60Pb40 solder alloy, tungsten filament and quartz tube. The elements are chosen according to the topology of the components and are suitable for high aspect ratio, which results in lesser no. of elements. All the components are meshed coarsely, and the elements utilize quadratic shape functions, with a minimum of two elements used through the thickness. A mesh sensitivity study was performed to verify that the results are independent of the mesh quality as seen in Table 3.
This model does not consider the pre-heating of the solar cell at hotplates 1 and 2. Instead, the experimentally measured maximum temperature of the solar cell before the start of IR heating is used as the initial temperature, T0, for the entire solar cell as it enters the IR heating zone. Additionally, solar cell metallization is not included in the model as it is not exposed to direct IR radiation, and back-side interconnections are neglected in this study.
The solar cell is exposed to two radiation pulses in the IR heating zone. During the first radiation pulse, the solar cell is heated by the radiation from IR emitters 1 and 2 as it enters the IR heating zone. Subsequently, the solar cell moves under IR emitters 2, 3, and 4, where the second radiation pulse heats them. The positions of the solar cell and the emitters during these steps are displayed in Figure 6. In addition to radiative heat transfer between the emitters and the solar cell, the solar cell also undergoes heat transfer with hotplate 3. The heating from hotplate 3 is modeled using a convective boundary condition. The temperature from the FEM simulation is validated using three K-type thermocouples fixed at different positions using the down-holder, measuring the real-time solar cell temperature during the entire IR soldering phase.
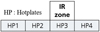 |
Fig. 3 Hotplates and IR zone position considered for the FEM model. |
Fractional emissive power of the IR emitters used in the FEM model.
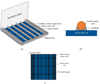 |
Fig. 5 a) Symmetric geometry of the silicon solar cell with solder-coated copper wire (ribbon) and the down-holder. b) Geometry of the copper wire, solder alloy and the silicon solar cell. c) Shaded region on a solar cell due to the down-holder during the IR soldering process. |
Material properties of the involved components used for the simulation.
Mesh sensitivity analysis.
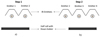 |
Fig. 6 Geometrical setup of the simulation during step 1 (a) and step 2 (b). |
3 Results and discussion
3.1 Parametric variation
The FEM model is simulated for four different cases of process parameters and also used experimentally to assess its robustness and sensitivity. The first three cases involve varying the power, PIR, supplied to the IR emitters, while the fourth case involves reducing the temperature of hotplate 3, THP3, by 20 °C. In all cases, the power of emitter 1 PIR1, is set to be 10% lower than the power of emitters 2, 3 and 4, PIR2 = PIR3 = PIR4 (denoted as PIR2). This helps in reducing the temperature gradient before the main heating by IR emitters 2, 3 and 4. The duration of both radiation pulses for all four cases is fixed at 1.2 s each. The initial solar cell temperature, T0, is determined from the maximum temperature measured on the solar cell during the validation process from the stringer before entering the IR heating zone. These process parameter configurations for the different cases are summarized in Table 4.
Figure 7 illustrates the solar cell temperature profile of all the cases from the FEM simulation. For case 1, the initial solar cell temperature before IR heating is recorded as 121 °C. From 0 s to 1.2 s, the first radiation pulse is emitted from IR emitters 1 and 2 (cf. Fig. 5a), elevating the solar cell temperature to 180 °C. Over the next 0.8 s, as the solar cell transitions to the next position inside the stringer, the temperature continues to rise due to the IR radiation at threshold levels between the radiation pulses. Between 2 s and 3.2 s, the second radiation pulse from IR emitters 2, 3 and 4 (cf. Fig. 5b) increases the temperature well above the melting liquidus temperature of the Sn60Pb40 solder (190 °C), reaching a maximum of 245 °C. After this pulse, as the solar cell moves out of the IR heating zone, the temperature slightly increases to a maximum of 250 °C at 3.8 s before starting to decrease within the cooling phase. A similar temperature ramp-up is also witnessed in the other three cases.
Process parameters used in the simulation and experiment for different cases.
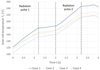 |
Fig. 7 Temperature profile of the solar cell for all the cases from simulation. |
3.2 Validation of FEM model
For validation of the simulation with experimental values, the temperature of five solar cells (N = 5) was measured for each case using both M6 SHJ and PERC half-cells contacted with thermocouples attached to the down-holder in the stringer. The experiments are conducted on an industrial stringer in the Module-TEC laboratory of Fraunhofer ISE at high throughput with 1.2 s of soldering time per solar cell. The difference in measured solar cell temperature TC between SHJ and PERC is insignificant for all four cases (results not shown here), despite the different optical parameters of the solar cells. Therefore, to determine the robustness of the model, cases 1, 3 and 4 are simulated for the PERC half-cell with an emissivity of ε = 0.75, and case 2 is simulated for the SHJ half-cell with an emissivity of ε = 0.70. Figure 8 compares the maximum solar cell temperatures obtained from the FEM model at the position x = 36 mm/y = 71 mm, with the measured values from the thermocouple positioned at the same mentioned location in the main heating zone. The gray area in the charts represents a min./max. band of N = 5 repetitions, while the dashed lines indicate the mean of the measured values. The comparison shows that the FEM model accurately predicts the temperature profile during the IR soldering process for different sets of process parameters. Further, case 1 has a maximum solar cell temperature of TC = 249 °C, as it has the highest power PIR2 = 70% of the IR emitters. For cases 2 and 3, as PIR2 decreases to 60% and 50%, respectively, we could see TC also decreasing to 233 °C and 219 °C. Additionally, in case 4, when THP is decreased from 160 °C to 140 °C compared to the other cases, keeping PIR2 = 60%, TC decreases from 233 °C to 218 °C.
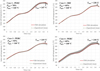 |
Fig. 8 Comparison of the solar cell temperature TC from simulation (red) and experiment (gray) during IR soldering of SHJ and PERC M6 half-cells for different cases of process parameters. The gray area represents the min./max. band of N = 5 repetitions, while the dashed lines indicate the mean of the measured values. |
3.3 Temperature homogeneity
At the end of the second radiation pulse (3.8 s), the maximum solar cell temperature is reached for all four cases. To compare the temperature homogeneity over the whole solar cell, the FEM model is compared with measurements of thermocouples at different positions on the solar cells. The results are presented in Figure 9. Correspondingly, the comparison of the measured temperature using three thermocouples at positions x1 = 8 mm/y1 = 42 mm, x2 = 36 mm/y2 = 71 mm and x3 = 66 mm/y3 = 42 mm on the solar cells for all four cases is displayed in Table 5. From the tables, we can see the FEM model is able to compute the inhomogeneous temperature of the solar cell accurately, with the maximum temperature difference being (8 ± 4) K. The solar cell temperature TC is around 26–36 K lower at the edges of the solar cells compared to the middle, depending on the parameter set. The dominant reason for this effect is that the intensity of the radiation reduces radially as the distance from the center of the solar cell increases. Another reason is the shading and reflection of the down-holder design, as it further blocks the incident IR radiation at the edges of the solar cell. By decreasing the power of the IR emitters PIR from 70% to 50% for cases 1 to 3, the difference in temperature inhomogeneity also decreases from ΔTC = 36K to ΔTC = 26 K. This shows that the inhomogeneity can also be reduced by finding the appropriate minimum power for PIR2 to heat the entire solar cell above the liquidus temperature of the solder.
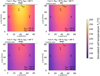 |
Fig. 9 Simulated temperature distribution on the solar cells at t = 3.8 s for different cases of process parameters measured at points 1,2 and 3. |
Comparison of measured and simulated solar cell temperature at x1 = 8 mm / y1 = 42 mm, x2 = 36 / y2 = 71 mm and x3 = 66 mm / y3 = 42 mm for probe number 1 to 3, respectively.
4 Conclusion
In summary, this study presents a novel FEM model designed to determine the temperature distribution of solar cells during the industrial IR soldering process. This model was developed based on the characteristics of an industrial IR soldering process, precisely considering all the critical influences, such as shading of the down-holder and reflection of radiation from the IR unit reflector, that govern the maximum temperature reached by the solar cell due to IR radiation. The model is validated by measuring the temperature of the solar cells during the IR soldering process at the stringer in three different positions using thermocouples for four different cases of process parameters with SHJ and PERC half-cells. The maximum solar cell temperature differences between the experiment and FEM model are observed to be consistently less than (8 ± 4) K in all cases, affirming the accuracy and reliability of the model. Therefore, the FEM model can be utilized to determine the temperature inhomogeneity during the IR soldering process. The model can be easily transferred to other solar cell types, such as TopCon. As such, this FEM model emerges as a robust tool capable of precisely predicting the temperature distribution during any industrial IR soldering process. This work aims to develop an alternative method for measuring temperature distribution on solar cells, as experimental measurements proved extremely challenging due to the moving down-holder and solar cells. As follow-up work, this FEM model will be used to perform a sensitivity study on the process parameters to reduce temperature inhomogeneity by identifying the optimal parameters for IR soldering across various solar cell technologies. Additionally, this model will also be utilized to optimize the material and geometry of the down-holder and the design of the IR emitters, such as using fewer emitters with increased length and arranging them in a radial setup to reduce inhomogeneity. In further work, a mechanical model will be developed and coupled to the thermal model to compute the induced thermomechanical stress due to the IR soldering process.
Funding
This research was funded by Federal Ministry for Economic Affairs and Climate Protection under MoQa project (Grant number 03EE1140B) and Quelle project (Grant number 03EE1172E).
Conflicts of interest
Authors declare no conflicts of interest.
Data availability statement
This article has no associated data generated or analyzed.
Author contribution statement
Conceptualization: Daniel C. Joseph and Andreas J. Beinert; Methodology: Daniel C. Joseph and Angela De Rose; Software: Daniel C. Joseph, Andreas J. Beinert; Validation: Angela De Rose, Dirk Eberlein and Onur Parlayan; Writing − Original Draft Preparation: Daniel C. Joseph and Angela De Rose; Writing − Review & Editing: Dirk Eberlein, Onur Parlayan, Benjamin Grübel and Andreas J. Beinert; Supervision: Andreas J. Beinert and Holger Neuhaus; Project Administration: Benjamin Grübel; Funding Acquisition: Holger Neuhaus.
References
- H. Wirth, K.-A. Weiß, C. Wiesmeier, Photovoltaic Modules (De Gruyter, 2016) [Google Scholar]
- H. Shin, E. Han, N. Park, D. Kim, Thermal residual stress analysis of soldering and lamination processes for fabrication of crystalline silicon photovoltaic modules, Energies 11, 3256 (2018). https://www.doi.org/10.3390/en11123256 [CrossRef] [Google Scholar]
- A.J. Beinert, P. Romer, M. Heinrich, J. Aktaa, H. Neuhaus, Thermomechanical design rules for photovoltaic modules, Prog. Photovolt. 31, 1181 (2023) [CrossRef] [Google Scholar]
- M. Hertl, D. Weidmann, J.-C. Lecomte, Microelectronics and Packaging Conference, 2009 (EMPC 2009) (European, 2009) [Google Scholar]
- T. Dullweber, L. Tous, Silicon Solar Cell Metallization and Module Technology (Institution of Engineering and Technology, 2021) [Google Scholar]
- A. de Rose, C. Rosado Alberdi, A. Kraft, Influence of IR Soldering Profile on Industrial Silicon Heterojunction Solar Cells, in WCPEC-8 (2022). https://www.doi.org/10.4229/WCPEC-82022-3CO.4.3 [Google Scholar]
- S. Wiese, F. Kraemer, N. Betzl, D. Wald, Interconnection technologies for photovoltaic modules − analysis of technological and mechanical problems, in 2010 11th International Thermal, Mechanical & Multi-Physics Simulation, and Experiments in Microelectronics and Microsystems (EuroSimE) (Bordeaux, France, 2010), p. 1 [Google Scholar]
- Z. Wang et al., Use finite element modelling to characterise the stress evolution in Multi Busbar interconnected half-cell tiled modules after soldering and lamination, Sol. Energy Mater. Sol. Cells 252, 112166 (2023). https://www.doi.org/10.1016/j.solmat.2022.112166 [CrossRef] [Google Scholar]
- L.C. Rendler, A. Kraft, C. Ebert, S. Wiese, U. Eitner, Investigation of Thermomechanical Stress in Solar Cells with Multi Busbar Interconnection by Finite Element Modeling, in EU PVSEC 2016 (2016). https://www.doi.org/10.4229/EUPVSEC20162016-1CO.11.2 [Google Scholar]
- B. Illés, O. Krammer, A. Géczy, Infrared Reflow Soldering (Elsevier, 2020) [Google Scholar]
- C.L. Wyatt, Blackbody radiation, Radiometric Calibration: Theory and Methods (Elsevier, 1978), p. 29 [Google Scholar]
- J.R. Howell, M.P. Menguc, R. Siegel, Thermal Radiation Heat Transfer (CRC Press, 2010) [CrossRef] [Google Scholar]
- B.E. Yoldas, T. O'Keefe, Deposition of optically transparent IR reflective coatings on glass, Appl. Optics 23, 3638 (1984). https://www.doi.org/10.1364/AO.23.003638 [CrossRef] [Google Scholar]
- R. Strauss, SMT Soldering Handbook (Elsevier Science & Technology Books, Jordan Hill, 2020) [Google Scholar]
- A. Jamnia, Practical Guide to the Packaging of Electronics: Thermal and Mechanical Design and Analysis, 2nd edn (CRC Press, Boca Raton, 2009) [Google Scholar]
- J.P. Joule, XXXVIII. On the heat evolved by metallic conductors of electricity, and in the cells of a battery during electrolysis, Dublin Philos. Mag. J. Sci. 19, 260 (1841). https://www.doi.org/10.1080/14786444108650416 [Google Scholar]
- Short Wave Quartz Emitters, https://freek-heaters.com/products/infrared-heaters/short-wave-quartz-emitters/ (accessed June 20, 2024) [Google Scholar]
- Y.S. Touloukian, D.P. DeWitt, Thermophysical Properties of Matter − The TPRC Data Series, (IFI/Plenum, New York, 1970), Vol. 7 [Google Scholar]
- M. Zhao, Z. Zhou, M. Zhong, J. Tan, Y. Lian, X. Liu, Thermal shock behavior of fine grained W-Y2O3 materials fabricated via two different manufacturing technologies, J. Nucl. Mater. 470, 236 (2016). https://www.doi.org/10.1016/j.jnucmat.2015.12.042 [CrossRef] [Google Scholar]
- F. Hu, S. Lucyszyn, Modelling miniature incandescent light bulbs for thermal infrared ‘THz Torch’ applications, J. Infrared Milli Terahz Waves 36, 350 (2015). https://www.doi.org/10.1007/s10762-014-0130-8 [CrossRef] [Google Scholar]
- M. Virág, J. Murin, Thermal field simulation of a tungsten filament lamp referring to its lifetime, J. Electr. Eng. 56, 252 (2005) [Google Scholar]
Cite this article as: Daniel Christopher Joseph, Angela De Rose, Dirk Eberlein, Onur Parlayan, Benjamin Grübel, Andreas J. Beinert, Holger Neuhaus, Investigation of temperature homogeneity during infrared soldering of silicon solar cells using the finite element method, EPJ Photovoltaics 16, 9 (2025)
Appendix A
The temperature of the tungsten filament (TF) within the IR emitter during the IR soldering process is a critical parameter for determining the emissive power radiating from the IR emitter. A thermoelectric simulation model is developed to compute the temperature of the tungsten filament. The heating of the tungsten filament is a result of the Joule heating effect, where the filament heats up when electric current passes through it due to its resistance. The filament is subjected to a maximum power of 1250 W at a nominal operating voltage of 230 V. Notably, the voltage applied to the filament is adjustable to achieve the desired temperature. This simulation model calculates the temperature of the tungsten filament under various power values.
The tungsten filament is modeled as a cylindrical tube with a diameter of 1 mm and a heating length of 230 mm. Temperature-dependent material properties, such as thermal conductivity, specific heat capacity at constant pressure, linearized resistivity, and emissivity for the tungsten filament, are obtained from [19,20].
The model was simulated in COMSOL Multiphysics 6.2. An electric potential difference of 22.5 V is applied to the two ends of the filament based on assumptions that simplify the spherical coil into a cylindrical component [21]. Initially, a stationary analysis is performed by varying the voltage from 10% to 100%, with 100% corresponding to 22.5 V. The results, summarized in Figure A.1, indicate that the filament reaches a maximum temperature of approximately 2040 °C at 100% power, matching the manufacturer's specified maximum temperature of 2036 °C.
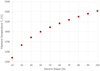 |
Fig. A.1 Maximum filament temperature at different power PIR supplied to the IR emitter. |
Subsequently, a time-dependent analysis is conducted to determine the temperature of the filament for each radiation pulse at different power levels (PIR). Each radiation pulse lasts for 1.2 seconds, followed by 0.8 seconds of cooling. Four cases with PIR set at 40%, 50%, 60%, and 70% are computed, and the corresponding temperature profiles over time for all four cases are shown in Figure A.2. These temperature values, based on the power percentage, are used as input for the global model.
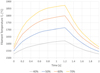 |
Fig. A.2 Temperature profile of the filament for one radiation pulse at different power supplied to the IR emitter. |
All Tables
Comparison of measured and simulated solar cell temperature at x1 = 8 mm / y1 = 42 mm, x2 = 36 / y2 = 71 mm and x3 = 66 mm / y3 = 42 mm for probe number 1 to 3, respectively.
All Figures
|
Fig. 1 a) Position of the hotplates and the IR zones in an industrial stringer. b) 2D view of an IR zone with 4 IR emitters in the stringer (front view). |
| In the text | |
|
Fig. 2 Typical thermal profile during IR soldering with Sn60Pb40 solder alloy. |
| In the text | |
|
Fig. 3 Hotplates and IR zone position considered for the FEM model. |
| In the text | |
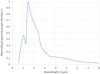 |
Fig. 4 Spectral power vs. wavelength of the IR emitters [17]. |
| In the text | |
|
Fig. 5 a) Symmetric geometry of the silicon solar cell with solder-coated copper wire (ribbon) and the down-holder. b) Geometry of the copper wire, solder alloy and the silicon solar cell. c) Shaded region on a solar cell due to the down-holder during the IR soldering process. |
| In the text | |
|
Fig. 6 Geometrical setup of the simulation during step 1 (a) and step 2 (b). |
| In the text | |
|
Fig. 7 Temperature profile of the solar cell for all the cases from simulation. |
| In the text | |
|
Fig. 8 Comparison of the solar cell temperature TC from simulation (red) and experiment (gray) during IR soldering of SHJ and PERC M6 half-cells for different cases of process parameters. The gray area represents the min./max. band of N = 5 repetitions, while the dashed lines indicate the mean of the measured values. |
| In the text | |
|
Fig. 9 Simulated temperature distribution on the solar cells at t = 3.8 s for different cases of process parameters measured at points 1,2 and 3. |
| In the text | |
|
Fig. A.1 Maximum filament temperature at different power PIR supplied to the IR emitter. |
| In the text | |
|
Fig. A.2 Temperature profile of the filament for one radiation pulse at different power supplied to the IR emitter. |
| In the text | |
Current usage metrics show cumulative count of Article Views (full-text article views including HTML views, PDF and ePub downloads, according to the available data) and Abstracts Views on Vision4Press platform.
Data correspond to usage on the plateform after 2015. The current usage metrics is available 48-96 hours after online publication and is updated daily on week days.
Initial download of the metrics may take a while.