| Issue |
EPJ Photovolt.
Volume 15, 2024
Special Issue on ‘EU PVSEC 2023: State of the Art and Developments in Photovoltaics’, edited by Robert Kenny and João Serra
|
|
|---|---|---|
| Article Number | 10 | |
| Number of page(s) | 14 | |
| DOI | https://doi.org/10.1051/epjpv/2024003 | |
| Published online | 01 April 2024 | |
https://doi.org/10.1051/epjpv/2024003
Original Article
Stress tolerance of lightweight glass-free PV modules for vehicle integration
1
École Polytechnique Fédérale de Lausanne (EPFL), Institute of Electrical and Micro Engineering (IEM), Photovoltaics and Thin-Film Electronics Laboratory (PV-lab), Rue de la Maladière 71b, 2000 Neuchâtel, Switzerland
2
CSEM, Sustainable Energy Center, Jaquet-Droz 1, Neuchâtel, 2000 Switzerland
3
Simoldes Plastics, Research & Innovation, Oliveira de Azeméis, Portugal
4
CEiiA, Automotive and Mobility Unit, Matosinhos, Portugal
* e-mail: This email address is being protected from spambots. You need JavaScript enabled to view it.
Received:
19
July
2023
Accepted:
14
January
2024
Published online: 1 April 2024
Abstract
Electric vehicles (EVs) currently dominate the sales in the automotive market. A big leap in this market can be made by developing a photovoltaic product that can be integrated to an EV, as it can boost the driving range of the EV while reducing the charging frequency. Such vehicle-integrated photovoltaic (VIPV) products are already successfully demonstrated, but they are usually made with glass as a front sheet – making them bulky and limiting their use to the car roofs due to safety reasons. The contemporary focus of the research in the field of VIPV is on developing a product that is lightweight (LW) and easily integrable into the complex shapes of an EV. Therefore, in this work, we present our initial findings on a novel architecture for LW VIPV modules employing polycarbonate (PC) as a front sheet. The mechanical behaviour of the LW module under bending is successfully simulated using finite elements (FE) modelling to predict the fracture of the solar cells, which can then be used as a predictive tool to check the maximal load on the PV body of an EV before cracking the c-Si solar cells. We demonstrate that a change in the temperature of the PC-based LW modules can modify the interspacing between the cells and thus create stress on the connectors. The dog-bone connectors are found to allow almost unconstrained movement of the cells in the module when subjected to variation of temperature. The cell movements may result in mechanical fatigue of the interconnection, which can ultimately result in disconnection of the cells. Initial performance of the dog-bone connectors is investigated by applying mechanical fatigue experiments, which demonstrate that the special geometry of the dog-bone connector could endure a greater number of thermal cycles than a simple prismatic shape would.
Key words: Vehicle-integrated photovoltaics / finite element simulations / dog-bone interconnection / VIPV / glass-free PV module / lightweight PV
© U. Desai et al., Published by EDP Sciences, 2024
 This is an Open Access article distributed under the terms of the Creative Commons Attribution License (https://creativecommons.org/licenses/by/4.0), which permits unrestricted use, distribution, and reproduction in any medium, provided the original work is properly cited.
1 Introduction
Automobiles like cars, trucks and buses can be converted into a source of electricity by using vehicle-integrated photovoltaics (VIPV), which convert solar energy into electrical energy ‘on-site’ to directly charge the vehicle battery. A recent report depicted that man-made CO2 emissions reached an all-time high in 2022 with 36.4 Gt [1]. Mobility accounts for around a fifth of these emissions, of which around 75% come from road transport [1]. The electrification of mobility is underway with the sale of 14 million electric cars worldwide, which represents 18% of the market in 2023. The forecasts of the International Energy Agency (IEA) gave a share of 60% market in 2030 for electric cars in China, the United States and Europe [2]. Regarding the decarbonization of electricity production, a clear downward trend is observed in Europe with a halving of carbon intensity between 1990 and 2021 (from 500 to less than 250 g CO2 eq./kWh, respectively) [3] although, at the global level, the value will still remain above 400 g CO2 eq./kWh in 2022 [4]. One solution, in order to increase the energy autonomy of electric vehicles and to reduce dependence on the local energy mix, would be the production of electricity on board through VIPV, which is also a recommendation in the European energy strategy since 2022 [5]. Typically, 5 m2 of 20% efficiency modules on a car would allow the generation of around 1000 kWh per year, representing an autonomy of 5000 km driving at a consumption of 20 kWh/100 km. This ability of the VIPV allows the EVs to produce and store energy even when stationary, which can be utilized later to drive the vehicle or its auxiliary components, as well as other equipment for vehicle experiences like cooling systems or leisure activities like camping. Therefore, VIPV can promote cleaner transportation and reduce the carbon footprint by reducing the dependence on fossil fuels.
The conventional glass-based PV modules are not desirable for integration into EVs because of their high density, which can adversely affect the driving range of the EV. Various published works have indicated the feasibility of employing a lightweight module that is glass-free for VIPV application. One approach is to use the transparent polymeric layer at the front to replace the bulky glass and employ glass fibre-reinforced polymer composite to provide the necessary stiffness to the modules [6]. Replacing the glass with a polymeric front sheet is lucrative since it is lighter than glass and has higher impact resistance. However, the main drawback of using a polymer front sheet is its higher coefficient of thermal expansion (CTE) than the glass, which can result in a higher thermal mismatch with the other materials in the module, resulting in greater thermally-induced stresses. Many studies were previously conducted on the feasibility of PC as a front sheet, but this technology has not been commercialized yet [7]. Eitner et al. [8], did an extensive investigation to study the cell gap variation in solar modules through both experiments and simulations. The experiment of the gap variation between the cells is used to validate and compare the different models of simulation [8]. They found that taking into account the viscoelasticity of the encapsulation layers gives the best agreement with experiments [8]. A generalized Maxwell model with Williams–Landel–Ferry parameters for the time-temperature superposition was used to extract the viscoelastic parameters for the simulations [8]. The Finite-Element-analysis of the complete module shows that the solar cells are under high compressive stress of up to 76 MPa as they are sandwiched between the stiff front glass and the strongly contracting plastic back sheet [8]. They also showed that the linear elastic model is sufficient for the silicon, glass or composite backsheet [8]. Hackmann et al. [7], studied the feasibility of polycarbonate as a front sheet for solar panels for the first time. It was observed that a high residual post-lamination stress occurs inside the module due to a mismatch in the coefficient of thermal expansion of the polycarbonate with other materials [7]. It was observed that increasing the number of encapsulant layers in the module resulted in stress relaxation. Furthermore, a thicker polycarbonate layer was found to decrease the bending of the module [7]. An effect of cooling rate on stress generation was also studied, which indicated that slower cooling was beneficial to reduce stress relaxation [7]. Thermo-mechanical FEM simulations were performed to support the experimental results on various layer setups [7]. Budiman et al. [9] investigated the adhesion strength at the PC/EVA interface using WTCB method, which calculates the critical value of the strain energy release rate (Gc) of the interface. Furthermore, Budiman et al. [9] improved the (Gc) of the PC/EVA interface by thermal treatment (i.e. dry-heating) of the PC-PC modules.
The present work enhances the current knowledge and depicts findings that could be useful for the further development of the VIPV based on the polymeric front sheet. The cell gap variation is experimentally determined and simulated for the dog-bone connected cells. The mechanical behaviour of the LW module is also simulated and verified with the experimental findings. The cell gap variation can lead to the fatigue of the interconnections – ultimately resulting in their failure. Therefore, mechanical fatigue experiments are performed to understand the effect of dog-bone geometry on fatigue life. It is found that the dog-bone connector could be beneficial for the improvement of the life of the LW modules since it can endure a higher number of fatigue cycles compared to simple prismatic interconnection.
2 Materials used
In the present work we have used 5 inches full-size interdigitated back contact (IBC) cells and half-cut (M6) size passivated emitter rear contact (PERC) cells. To study the effect of mechanical loads PERC cells were used while, to study the effect of the thermal stress IBC cells with dog-bone type connectors were used due to a general consensus in the PV community that the dog-bone connectors perform well under thermal cycling. A summary of the experimental details is presented in Table 1.
Polycarbonate was used as a front sheet, and a feron back sheet was employed to cover the backside of the modules. Thermoplastic polyurethane (TPU) was used in the modules as an encapsulation layer. The thickness PC front sheet, TPU and Feron back sheet used in this work is 3 mm, 635 μm thick, 183 μm, respectively. A dog-bone connector, which is a 125 μm thick copper bar coated with 25 μm of tin at each side, was used to connect the cells. The mechanical behaviour of the LW modules was studied using M6 half-cells, while experiments to understand the cell gap variation were conducted on the IBC cells of full size. Furthermore, fatigue experiments were conducted on the dog-bone connector at two locations: one at the centre of the connector and the other where a continuous shape is present.
Summary of the cell sizes and technology used in different experiments.
3 Experimental
3.1 Architecture and lamination of the LW modules
The architecture of the LW modules is presented in Figure 1. The PERC cells are encapsulated using three layers of encapsulant in front and four layers at the bottom of the cells. PC is used as the front sheet, while a feron back sheet was used to cover the back of the modules. A thermocouple was put between two encapsulant layers at the back of the cells when required.
Lamination is performed at 145°C using a membrane laminator (3S Meyer Burger made S2821CP), keeping the polycarbonate front-sheet side adjacent to the hot plate. In this work, a two-step lamination process is followed of which; the first step involves heating the module stack for 35 min with the pins out, followed by a second step in which the pins are retracted into the heating plate—thereby allowing contact between the PC sheet and aluminium plate for 5 min during which the upper membrane applied pressure of 900 mbar on the stack. Upon completion of the lamination process, the laminated module is removed from the laminator and allowed to cool in the laboratory air, by placing it on a separate heating plate that was initially maintained at 145°C and allowed to thermally equilibrate with the laboratory air.
 |
Fig. 1 Architecture of the LW modules studied for (a) mechanical loading experiments – employing half-cells and (b) cell gap measurements – employing full-size IBC cells. |
3.2 Mechanical load test
A custom-made set-up was used for the mechanical load tests (MLT), as shown in Figure 2. The modules (30 cm × 40 cm) are clamped at six locations, and the vacuum cups are used to apply the mechanical load by exerting pressure on the module. A displacement sensor is placed underneath the module at the centre.
 |
Fig. 2 Set-up for mechanical loading on LW modules. The module was fixed using six clamps, and the vacuum cups were used to apply the load. |
4 Characterization
4.1 Electroluminescence images
The EL images were recorded by injecting a current of Isc into the modules using a camera from Sensovation's SamBa series (Sensovation SamBa CI Camera GigE) with an integration time of 3000 ms.
4.2 Rheological characterization of TPU
The rheological properties (i.e., storage modulus and loss modulus) for TPU encapsulant has been determined by performing dynamic mechanical analysis (DMA) for lower temperatures (−40°C to 30°C) using TA Instrument, Q800 model and by moving die rheometer (MDR) D-MDR3000 model for temperature range of 20 °C and 150 °C. For the DMA experiments, an amplitude of 15 μm and frequency sweep between 0.5 and 20 Hz for eight equally spaced values on a logarithmic scale are chosen. During the experiments, temperature is varied with a ramp of 5 °C/min. For the MDR experiments, samples of TPU are prepared in the shape of disks of 3 cm diameter with a weight of 3 g, which are placed between two flat plates of which one was fixed, and the other was allowed to oscillate at a specified frequency to have 1% resultant shear strain on the samples. Rheological properties are determined for 30 values equally spaced on a logarithmic scale by sweeping frequency between 0.5 and 50 Hz. The methodology followed during the experiments is described in the Figure 3.
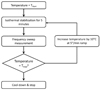 |
Fig. 3 Flowchart describing the methodology followed for change of temperature. The experiments were performed always in the isothermal condition. |
4.3 Inter-cell distance variation with temperature
The inter-cell gap variation is studied by varying the temperature between 85 °C and −40 °C. To determine the actual temperature of the cells, a K-type thermocouple is placed between the second and third layers of TPU behind the cells. The cell-gap variation was determined by taking pictures using a USB microscope (CMOS 1.3 MPixel) and later post-processing with open-source software ImageJ [10].
4.4 Strain-controlled low cycle fatigue experiments on dog-bone connectors
In this work, the strain-controlled low-cycle fatigue experiments are performed on the dog-bone connector and prismatic connector under compressive loads. The dog-bone connectors are specially used for interconnection of the IBC solar cells by soldering at only three spots at the back of each solar cells (Fig. 4). Due to the special geometry of the dog-bone connectors, they can attain greater deflection as compared to the commercial prismatic connectors commonly used for the interconnection of the PERC solar cells by soldering on the busbars of the cells.
The compressive fatigue cycling allowed us to study the effect of the out-of-plane deformation of the connectors. Another reason for doing the compressive fatigue cycling was the straightforward approach for tensile fatigue cycling in which the dog-bone shape, which had a discontinuous shape, would first fail by developing fatigue cracks in the regions of stress concentration. The stress concentration in the compressive loading can also result in the failure of the component; however, during the compressive loading the component can also fail by buckling. Furthermore, the thermal cycling can also result in compressive stresses; hence it is more relevant to reality. Therefore, we have selected the compressive loading for the experiments.
The experiments were performed using a Zwick tensile testing machine with a load cell of 1 kN in the displacement-controlled mode by manually applying each cycle between 0 and −50% strain. The regions with the orange and white coloured boxes in Figure 4 show the areas of the dog-bone connector and prismatic bar connector used for the experiments. The schematic presented in Figure 5 also shows the boundary conditions of the experiments along with the gauge length. The load-displacement data could be recorded only during the first half of the cycle. Upon reaching the upper strain limit, the cross-arm of the machine was retracted at the same rate as for the loading and brought to the initial position (i.e., zero strain). This way, controlled fatigue experiments were performed on the connectors.
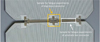 |
Fig. 4 The dog-bone connector shown connects the IBC solar cells in LW module. The square in orange and white coloured boxes indicate the regions chosen for fatigue of the dog-bone connector and the prismatic bar connector. |
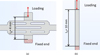 |
Fig. 5 Schematics for the fatigue loading on (a) dog-bone connector and (b) prismatic bar connector. |
5 Finite Element simulations
Finite Element (FE) simulations are performed using commercial software COMSOL Multiphysics 5.3 to simulate the mechanical and thermo-mechanical behaviour of the LW modules. Information on the geometry, material property, boundary conditions and mesh are explained in the following part.
Once we have the experimental displacements, we aim to do a FEM simulation that fits these values. Firstly, a simulation with a linear elastic model for all the materials is done (material properties given in Tab. 2).
Material properties used in the simulations.
5.1 Material properties
The material properties used for the simulation are presented in Table 2. The Young's modulus for PC is taken from hyper-elastic model while for TPU it is taken from the viscoelastic model. The other materials are modelled as linear-elastic, and the properties are taken from literature.
5.2 FE mesh
3D tetrahedral elements are used to generate FE mesh in the present model of the LW module (Fig. 6), such that the solar cells and the connectors have the finest mesh elements, whereas the encapsulant and the PC have coarse elements. For each geometry layer, sweeping in the thickness direction with five increments per layer was done.
 |
Fig. 6 Mesh of the different layers. (a) Free triangular mesh at the level of the cell's top, (b) the free triangular mesh is distributed in height into the TPU, cells, and Feron back sheet, (c) polycarbonate is meshed using free tetrahedral elements, and (d) meshing strategy used for the dog-bone interconnector. |
5.3 Boundary conditions
The mechanical loading experiments use six clamps to fix the modules, and loads are applied using four vacuum cups. For the FE simulations of mechanical loading, the constraint was modelled using the partitions that are 1 cm wide on each side of the model (Fig. 7). Four circles on the top of the polycarbonate represent the surface on which the load is applied (Fig. 7).
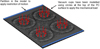 |
Fig. 7 Boundary conditions used for mechanical loading – the red arrows show the location at which the loads were applied, while the blue region shows the location where the clamps were modelled. |
6 Results and discussion
6.1 Hyper-elastic model of PC
The stress-strain response of PC in the elastic region is non-linear. Therefore, determining Young's modulus and other elastic constants is not straightforward for PC. As per the literature [11], the hyper-elastic model best describes the elastic behaviour of PC, which requires curve fitting to determine the elastic constants. Experimental data (Fig. 8) from the literature [12] is fitted with Yeoh's 3rd-order polynomial fit to get the three fitting constants, C1, C2 and C3, which are presented in Table 3. These fitting parameters are then given as input to model the response of the PC in the COMSOL software.
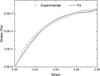 |
Fig. 8 Yeoh 3rd order fit (line) fit on the uniaxial tensile stress-strain curve of polycarbonate (dot), retrieved from [12]. |
Fitting parameters for the hyperelastic model using Yeoh's model.
6.2 Rheological behaviour of TPU
The full viscoelastic analysis is done for TPU and presented in the form of a log-log plot in Figure 9 below for the range of temperatures from −40 °C to 150 °C and frequencies from 0.5 to 50 Hz. Using this temperature and frequency range, the master curves are constructed with a reference temperature of 80 °C by shifting the individual curves horizontally using the temperature shift factor. The same shift factor is used for the generation of master curves for both the storage modulus and loss modulus.
Furthermore, the William-Landel-Ferry equation is fitted to the shift factors, and the constants obtained are C1 = 6.36 and C2 = 208.3 K−1 for the reference temperature of 80 °C. Continuous relaxation spectrum (CRS) is obtained from the master curves using a Matlab script taken from the literature [13]. A discrete approximation, called discrete relaxation spectrum (DRS), is made using the Prony-Series. The resultant relaxation function (G) for TPU has nine relaxation elements (Gi), as shown in Figure 10. The viscoelastic behaviour of the TPU encapsulant is simulated using 9 Maxwell relaxation elements for a reference temperature of 80 °C and a G∞ of 0 Pa. These nine relaxation terms are given as input to the COMSOL software to simulate the behaviour of the encapsulant.
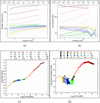 |
Fig. 9 Visco-elastic analysis for TPU encapsulant: (a) storage modulus, (b) loss modulus, (c) log-log plot of storage modulus master curve, (d) log-log plot of loss modulus master curve. The reference temperature of 80 °C was chosen for the generation of master curves. |
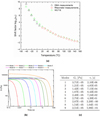 |
Fig. 10 (a) WLF (William-Landel-Ferry) fit on the shift factors obtained by the master curve generation, (b): estimated relaxation function of PF-2500 at 80 °C, (c): modes describing the estimated relaxation function of PF2500 TPU at 80 °C. |
6.3 Mechanical load test
For the LW module, the load vs out-of-plane displacement diagram is presented in the Figure 11 and compared to the results of the FE simulations.
The comparison between the experimental results and the FE simulations is presented in Figure 12. The simulations match very well the experimental data till about 700 N load and deviate a bit for larger deformations. The deviation, from the experimental findings, for higher deformation could be because of the difference in the PC properties (literature vs experiment) to fit the hyperelastic model. For further validation of the FE model, the load corresponding to a typical fracture strength of silicon (i.e., 200 MPa for cracks dimension in a c-Si wafer of 5 microns or below) was calculated to be ≈ 1150 N. The LW module was then successively loaded till 1150 N load, and during this, the EL images were recorded at different instances. It was observed that the solar cells in modules do not crack until an 1150 N load is applied, which corresponds to a typical fracture strength of silicon. The work done here can be useful to understand the effect of different boundary conditions (i.e., mounting strategies) or the thickness of the PC and encapsulant layers on the generation of stress in solar cells.
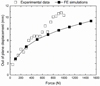 |
Fig. 11 Absolute values of the module centre displacement using hyper-elastic material properties of PC. |
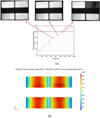 |
Fig. 12 (a) Evolution of the maximum principal stress in the cells with applied force. The stresses in cells reach the ultimate tensile strength of silicon (≈200 MPa) when the applied load reaches 1150 N load and (b) FE simulation of maximum principal stress in the solar cells of the LW module when the applied load reaches 1150 N. |
6.4 Cell-gap variation
The variation of the cell-gap is calculated and presented in Figure 13, below. The change of the cell gap is experimentally determined for the cells without an interconnection (Fig. 13a) and compared with the case of the cells interconnected by the dog-bone connector (Fig. 13b). The initial gap width between the cell is 1.7 mm. The variation in cell gap is calculated by considering the cell gap at 25 °C as a reference value, as can be seen in Figure 13, when the temperature is increased from 25 °C to 85 °C, the cell gap increases (i.e., the cells move away from each other) but reduces when the module is cooled down to −40 °C. This relative movement of the cells can potentially result in the disconnection of the solder joint or complete fracture of the interconnection due to fatigue stresses.
FE simulations are performed to emulate the experimental findings by considering the hyper-elastic model for polycarbonate and the viscoelastic model for TPU. The model, however, did not consider the plasticity of the interconnection (i.e., both the copper and the solder) to reduce the computational cost. It is observed during the experiments and simulations that the cell movements for both the free cells and the inter-connected cells are almost the same, which indicates the ability of the connector to allow unconstrained deformations till about 500 μm during thermal cycling. The slopes of the linear trendline of the measured points are summarised in Table 4. A higher slope indicates greater relative movement of the cells.
These experimental findings indicate that the variation in cell gap during thermal cycling can lead to fatigue of the cell interconnection, which can potentially result in the disconnection of the two cells.
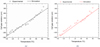 |
Fig. 13 Experimental and simulation results of the cell-gap variations as a function of the temperature: (a) without interconnection and (b) with interconnection. |
Comparison of the slope for the two scenarios. A higher slope indicates greater displacement for the same change in temperature.
6.5 Effect of strain-controlled low cycle fatigue loading on the connectors
During the diurnal temperature changes, the solar cells are expected to move within the LW modules, i.e., the gap between the cells will increase when heated above the room temperature while it will reduce if the module is cooled down. These changes in the cell gap can generate mechanical stresses in the interconnects through fatigue cycling. Therefore, it is essential to understand and compare the number of cycles that can be passed before the interconnect fractures. To study this phenomenon in LW modules, two types of interconnects are chosen and subjected to compressive mechanical fatigue cycles within the limits of −50% strain. The results of load vs displacement of both connectors are shown in the following Figure 14.
It is observed for both connectors that the maximum load for the first cycle is greater than the successive cycles. The onset of buckling of the connectors in the first cycle is believed to be the reason behind this phenomenon, as it requires greater force. The negative loads for very small displacements could be because of the plastic deformation after the first cycle. Furthermore, the buckling was initiated during the first cycle wherein out-of-plane deformation of the sample occurred. The first negative plateau is due to the previous cycle plastic deformation which induce elastic tensile stress before reaching the next plastic deformation. The second plateau occurs when the compressive stress is present on the sample. It is also observed that the prismatic bar endured 27 cycles before failure, but the dog-bone connector sustained 50 cycles. This indicates that the discontinuous geometry of the dog-bone connector allows greater flexibility (deformation), which resulted in a higher number of cycles to fail. However, after 50 cycles, fatigue cracks appeared near the regions of stress concentration, as indicated in Figure 15.
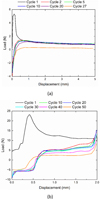 |
Fig. 14 Load vs displacement diagram for the interconnects: (a) prismatic bar type and (b) dog-bone type. |
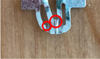 |
Fig. 15 In the red circles are some fatigue cracks initiations for the dog-bone connectors after compressive cyclic loading. |
7 Conclusions
This work focused on the (thermo)mechanical behaviour of polycarbonate based lightweight modules, which has the potential to be integrated into vehicles. The significant findings of this work are the following:
The mechanical behaviour of the PC-based LW module was successfully simulated using hyper-elastic material properties for polycarbonate front-sheet and visco-elastic properties for TPU encapsulant. The ability of the LW modules can be checked using this FE model for various profiles of an automobile vehicle body.
Dog-bone connectors allowed almost the same extent of variation in cell gap as the cells without an interconnection—indicating the ability of the dog-bone connector to allow greater deformations when the temperature of the LW module was changed between 85 °C and −40 °C.
-
The compressive fatigue cycling experiments indicated that the dog-bone connector could sustain 50 compressive fatigue cycles, almost double that of the prismatic connector, which failed after just 27 cycles. This is attributed to the geometry of the dog-bone connector that allows greater flexibility.
Funding
This work has been funded in part by the Office Federal de l’Energie (OFEN) under the Solarbody project (#IS/512317-01) and by Portugal 2020 Program under the PVAB (PhotoVoltaic Automotive Body) project (48166). The authors also like to acknowledge the help received from the LPAC laboratory at EPFL Lausanne for DMA experiments. The authors also acknowledge the financial support received through Horizon Europe SeamlessPV project and Delight OFEN project number SI/502501.
Conflicts of interest
Authors declare no conflicts of interest.
Data availability statement
The data can be made available by sending a reasonable request to the corresponding author.
Author contribution statement
Original draft: Umang Desai, Review and editing: Umang Desai, Antonin Faes, Kléber Nicolet, Christophe Ballif, Julien Robin, Cristiano Cunha, José Silva, Fahradin Mujovi, Sukanya Prabhudesai, Experiments: Louis Jacques, Kléber Nicolet, Umang Desai, Validation and data curing: Umang Desai, Antonin Faes, Kléber Nicolet, Louis Jacques Funding and infrastructure: Matthieu Despeisse, Aïcha Hessler-Wyser, Antonin Faes, Christophe Ballif
References
- H. Ritchie, Cars, planes, trains: where do CO2 emissions from transport come from?, accessed: Jun. 20, 2023, https://ourworldindata.org/co2-emissions-from-transport [Google Scholar]
- IEA, Demand for electric cars is booming, with sales expected to leap 35% this year after a record-breaking 2022, accessed: Jun. 20, 2023, https://www.iea.org/news/demand-for-electric-cars-is-booming-with-sales-expected-to-leap-35-this-year-after-a-record-breaking-2022 [Google Scholar]
- European Environment Agency, Greenhouse gas emission intensity of electricity generation, accessed: Jun. 20, 2023, https://www.eea.europa.eu/data-and-maps/daviz/co2-emission-intensity-12#tab-googlechartid_chart_11 [Google Scholar]
- M. Wiatros-Motyka, Global Electricity Review 2023, accessed: Jun. 20, 2023, https://ember-climate.org/insights/research/global-electricity-review-2023/ [Google Scholar]
- EUR-lex, Communication from the commission to the European parliament, the Council, the European economic and social committee and the committee of the regions, accessed: Jun. 20, 2023,https://eur-lex.europa.eu/legal-content/EN/TXT/?uri=COM%3A2022%3A221%3AFIN&qid=1653034500503 [Google Scholar]
- C. Kutter, F. Basler, L.E. Alanis, J. Markert, M. Heinrich, D.H. Neuhaus, Integrated lightweight, glass-free PV module technology for box bodies of commercial trucks, in 37th European Photovoltaic Solar Energy Conference (EUPVSEC), 2020, no. November, pp. 1711, doi: 10.4229/EUPVSEC20202020-6DO.11.6 [Google Scholar]
- M.M. Hackmann et al., Technical feasibility study on polycarbonate solar panels, Sol. Energy Mater. Sol. Cells, 84, 105 (2004) [CrossRef] [Google Scholar]
- U. Eitner, Thermomechanics of photovoltaic modules (Martin-Luther-Universität Halle Wittenberg, 2011) [Google Scholar]
- A.S. Budiman et al., Enabling lightweight polycarbonate-polycarbonate (PC-PC) photovoltaics module technology – Enhancing integration of silicon solar cells into aesthetic design for greener building and urban structures, Sol. Energy 235, 129 (2022) [CrossRef] [Google Scholar]
- C.A. Schneider, W.S. Rasband, K.W. Eliceiri, NIH Image to ImageJ: 25 years of image analysis, Nat. Methods 9, 537 (2012) [Google Scholar]
- Y.W. Chang, J.H. Cheng, Material characterization of polycarbonate near glass transition temperature, J. Chin. Inst. Eng. Trans. Chin. Inst. Eng., Ser. A, 35, 967 (2012) [Google Scholar]
- M. Sepe, The Effects of Stress on Polymers, accessed: Sep. 25, 2023, https://www.ptonline.com/articles/the-effects-of-stress [Google Scholar]
- S. Shanbhag, pyReSpect: A Computer Program to Extract Discrete and Continuous Spectra from Stress Relaxation Experiments, Macromol. Theory Simul. 28, 3 (2019) [CrossRef] [Google Scholar]
Cite this article as: Umang Desai, Kléber Nicolet, Sukanya Prabhudesai, Gianluca Cattaneo, Julien Robin, Cristiano Cunha, José Silva, Louis Jacques, Fahradin Mujovi, Matthieu Despeisse, Aïcha Hessler-Wyser, Antonin Faes, Christophe Ballif, Stress tolerance of lightweight glass-free PV modules for vehicle integration, EPJ Photovoltaics 15, 10 (2024)
All Tables
Comparison of the slope for the two scenarios. A higher slope indicates greater displacement for the same change in temperature.
All Figures
|
Fig. 1 Architecture of the LW modules studied for (a) mechanical loading experiments – employing half-cells and (b) cell gap measurements – employing full-size IBC cells. |
| In the text | |
|
Fig. 2 Set-up for mechanical loading on LW modules. The module was fixed using six clamps, and the vacuum cups were used to apply the load. |
| In the text | |
|
Fig. 3 Flowchart describing the methodology followed for change of temperature. The experiments were performed always in the isothermal condition. |
| In the text | |
|
Fig. 4 The dog-bone connector shown connects the IBC solar cells in LW module. The square in orange and white coloured boxes indicate the regions chosen for fatigue of the dog-bone connector and the prismatic bar connector. |
| In the text | |
|
Fig. 5 Schematics for the fatigue loading on (a) dog-bone connector and (b) prismatic bar connector. |
| In the text | |
|
Fig. 6 Mesh of the different layers. (a) Free triangular mesh at the level of the cell's top, (b) the free triangular mesh is distributed in height into the TPU, cells, and Feron back sheet, (c) polycarbonate is meshed using free tetrahedral elements, and (d) meshing strategy used for the dog-bone interconnector. |
| In the text | |
|
Fig. 7 Boundary conditions used for mechanical loading – the red arrows show the location at which the loads were applied, while the blue region shows the location where the clamps were modelled. |
| In the text | |
|
Fig. 8 Yeoh 3rd order fit (line) fit on the uniaxial tensile stress-strain curve of polycarbonate (dot), retrieved from [12]. |
| In the text | |
|
Fig. 9 Visco-elastic analysis for TPU encapsulant: (a) storage modulus, (b) loss modulus, (c) log-log plot of storage modulus master curve, (d) log-log plot of loss modulus master curve. The reference temperature of 80 °C was chosen for the generation of master curves. |
| In the text | |
|
Fig. 10 (a) WLF (William-Landel-Ferry) fit on the shift factors obtained by the master curve generation, (b): estimated relaxation function of PF-2500 at 80 °C, (c): modes describing the estimated relaxation function of PF2500 TPU at 80 °C. |
| In the text | |
|
Fig. 11 Absolute values of the module centre displacement using hyper-elastic material properties of PC. |
| In the text | |
|
Fig. 12 (a) Evolution of the maximum principal stress in the cells with applied force. The stresses in cells reach the ultimate tensile strength of silicon (≈200 MPa) when the applied load reaches 1150 N load and (b) FE simulation of maximum principal stress in the solar cells of the LW module when the applied load reaches 1150 N. |
| In the text | |
|
Fig. 13 Experimental and simulation results of the cell-gap variations as a function of the temperature: (a) without interconnection and (b) with interconnection. |
| In the text | |
|
Fig. 14 Load vs displacement diagram for the interconnects: (a) prismatic bar type and (b) dog-bone type. |
| In the text | |
|
Fig. 15 In the red circles are some fatigue cracks initiations for the dog-bone connectors after compressive cyclic loading. |
| In the text | |
Current usage metrics show cumulative count of Article Views (full-text article views including HTML views, PDF and ePub downloads, according to the available data) and Abstracts Views on Vision4Press platform.
Data correspond to usage on the plateform after 2015. The current usage metrics is available 48-96 hours after online publication and is updated daily on week days.
Initial download of the metrics may take a while.