| Issue |
EPJ Photovolt.
Volume 17, 2026
Special Issue on ‘EU PVSEC 2025: State of the Art and Developments in Photovoltaics', edited by Robert Kenny and Carlos del Cañizo
|
|
|---|---|---|
| Article Number | 9 | |
| Number of page(s) | 9 | |
| DOI | https://doi.org/10.1051/epjpv/2026004 | |
| Published online | 16 February 2026 | |
https://doi.org/10.1051/epjpv/2026004
Original Article
Analyzing and modeling snow loss and snow loss accumulation in ground-mounted photovoltaic systems
1
Department of Solar Power Systems, Institute for Energy Technology, Kjeller 2007, Norway
2
University of Agder, Department of Engineering Sciences, Grimstad 4879, Norway
3
PVRADAR Labs GmbH, Ebersberg 85560, Germany
* e-mail: This email address is being protected from spambots. You need JavaScript enabled to view it.
Received:
30
September
2025
Accepted:
27
January
2026
Published online: 16 February 2026
Abstract
Snow can cause significant energy loss in photovoltaic systems, making it essential to account for in performance modeling for all snow-prone regions. Previous snow loss research has been conducted primarily for roof mounted systems, and there is a lack of reported snow losses and validation of snow loss models for ground mounted systems. The aim of this work is to quantify snow loss and validate the Marion snow loss model for ground mounted PV systems using data from two scientific test sites in Norway. The quantification of snow losses indicates that ground mounted systems have lower snow losses compared to what have previously been documented for roof mounted systems in Norway and similar climates. Additionally, monofacial and bifacial arrays experienced similar losses. At the same test site, the bifacial array’s monthly losses were, on average, 0.2 percentage points higher than those of the monofacial array. In the snow loss model validation, the impact of snow data quality was evaluated. The global weather snow data sources assessed (ERA5-Land and ERA5 global) had a large share of snowfall events not giving snow accumulation. These events were linked to both small snowfalls and higher temperatures. The default pvlib implementation of the Marion model typically underestimates losses, but the error in relative yearly losses is less than 0.5 percentage points. The error in the modeling is mainly related to periods where the temperature is close to zero, when both the snow input data and the prediction of snow shedding are more uncertain. Ground interference due to large snow depths also leads to slower shedding and underestimation of losses in the model.
Key words: PV performance / snow loss / snow loss modeling / PV systems
© M.B. Øgaard et al., Published by EDP Sciences, 2026
 This is an Open Access article distributed under the terms of the Creative Commons Attribution License (https://creativecommons.org/licenses/by/4.0), which permits unrestricted use, distribution, and reproduction in any medium, provided the original work is properly cited.
1 Introduction
Snow cover on photovoltaic (PV) modules can lead to significant losses. In the most severe cases, monthly losses of 100% and annual losses of 30% have been reported [1]. However, snow loss is significantly impacted by local weather and snow conditions, as well as the configuration of the PV system [2]. Therefore, large spatial, temporal and system specific variations in snow loss are expected. To accurately estimate losses, a model considering the most influential factors is necessary.
Snow loss modeling is relevant in all applications where PV modeling is used, and in all regions with snow. In snowy regions, losses can be substantial and can impact the economic feasibility of PV projects. Snow loss is therefore essential to include in yield modeling of systems in these regions, and in energy system modeling where PV is matched with for example load, battery, or included in a hybrid system. If passive or active snow loss mitigation solutions are considered in the planning phase of systems, a snow loss model should be used to evaluate the need and impact of these solutions. In O&M, snow loss modeling can be used as input to the monitoring system, and it can support the planning of snow removal, by indicating the likelihood of natural snow clearing. As snow can shut down the PV power generation for several hours or days, snow loss modeling will also be valuable in forecasting. If not accounted for, forecasting errors are significantly higher in periods with snow [3]. With larger shares of PV in the grid, the value of accurate snow loss modelling for forecasting increases. For applications such as O&M and forecasting, snow loss modeling is valuable in regions with either seasonal or transient snow in the winter. Figure 1 shows the number of days with snowfall in Europe in 2024, illustrating how many times PV electricity production may be affected. Seasonal or transient snow is also expected for large areas in other large PV markets, such as China, USA and Japan.
Several aspects of the impact of snow in ground mounted PV systems have been investigated in scientific literature. In comparisons between monofacial and bifacial arrays, slightly higher performance in bifacial systems have been documented by Hayibo et al. [4] and Beraki et al. [5]. Hedari et al. [6] documented that reduction in tilt angle and increase in ground interference increased snow losses. Cooper et al. [7] also shows that increase in tilt results in reduced losses. Frimannslund et al. [8] described snow drift formation in ground mounted PV plants in polar regions.
Reported loss values and snow estimation methods with high time resolution for ground-mounted systems are, however, lacking. Studies of snow loss have to a large degree been dominated by roof systems, possibly because high latitude PV markets have been dominated by such installations. But recently, the share of ground mounted systems has been increasing in high latitude countries, and the need for numbers on loss values and loss estimation methods for these types of systems is increasing. Several snow loss models have been suggested [1], but most of them are only developed for estimating monthly or annual losses. This is relevant for some applications, such as estimations of annual yield, but it will not be sufficient for use in, for example, O&M or forecasting, where it is important to capture variations on high time resolution. One of the most widely validated models, the snow loss model suggested by Marion et al. [9], also works at high time resolutions, but it is mainly validated on roof systems. In the original publication, the empirical snow clearing coefficient used in the model is estimated for ground mounted systems, but this is only based on one system. For roof mounted systems several installations with varying tilt angles are used to estimate the coefficient. In publications where the Marion snow loss model has been tested on ground mounted systems, Riley et al. [10] report that the empirical snow clearing coefficient should be increased for systems with frameless modules. Ma et al. [11] finds that the default implementation of the model overestimates annual losses by 1.4 percentage points but notes that this discrepancy can be reduced by applying site-specific empirical factors.
In the Marion snow loss model, it is assumed that a snowfall over a chosen threshold will lead to snow accumulation on the modules. There are several factors related to this assumption that are not widely explored for PV modules. There is a lack of studies on what this snowfall threshold should be, and how type of snow (water content etc.) affects it [2]. Module tilt is another factor that challenges snow accumulation estimation, as snow accumulation is reduced on high tilt surfaces [12]. Several examples show very low or no accumulation of snow on high tilt/vertical PV modules [13], but observations of snow accumulation on these surfaces do exist [14,15]. Ice formation is a possible explanation of these contradictory observations. Snow has low adhesion to glass [16], but high cohesion [17]. Snow will therefore attach more easily to frost, rime and ice than bare PV module glass. Preceding occurrence of frost, rime or ice can thus promote snow accumulation on high tilt PV modules. There are several factors impacting icing, such as air temperature, wind speed and direction, type of precipitation, and water content in the air, making accurate predictions of accumulation challenging [18,19]. More research is needed to identify at which tilt angles snow accumulation is less likely, and under which weather conditions that snow accumulation can still occur on very high tilt/vertical PV modules.
The aim of this work is to quantify snow loss in ground mounted PV systems, to use these losses to validate the Marion snow loss model for ground mounted PV systems, and to identify areas of model improvement. We also assess the snow accumulation assumptions of the model, and we evaluate different snow data sources. With this we aim to improve knowledge on PV performance and modeling of PV in areas with snow.
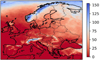 |
Fig. 1 Number of days with snowfall in 2024. Data from Copernicus Atmosphere Monitoring Service, 2025. |
2 Material and methods
In this work we first quantify snow losses in ground mounted monofacial and bifacial PV systems, and then the snow loss values are used to validate the Marion snow loss model and assess areas of improvements. We also assess the snow accumulation assumptions of the model by relating observed snow accumulation in the system with snowfall data from different data sources. The data are described in Section 2.1 the snow loss quantification in Section 2.2 and the snow loss modeling and model validation in Section 2.3.
2.1 Dataset
An overview of the two research PV sites analyzed in this work is given in Table 1. The test sites are selected because of the local weather measurements enabling accurate loss estimation and accurate input variables to the snow loss model, and the time series of multiple years, covering different types of weather conditions. The table displays the PV technology of the sites and orientation of the modules, module tilt, geographical position, Köppen-Geiger climate classification [20], and the length of the time series. From the lowland test site, 3 arrays with each 10 modules connected in series are studied. Two of the arrays consist of monofacial modules, one with half-cell modules and one with full cell modules. The third array consists of bifacial modules. Each array is connected to a SolarEdge SE3680H inverter, where the output power is measured. In winter, the arrays are periodically shaded by nearby buildings. This impacts the monofacial arrays to a larger degree than the bifacial array. At the mountain test site 2 arrays with 2 modules each are studied. One array consists of monofacial modules, and the second bifacial modules. Both arrays are connected to the same MOD 600TL3-X Growatt inverter, and the output of each module is measured by optimizers. The monofacial array is in periods shaded by the weather station. All the arrays at both test sites are oriented South, with an azimuth angle of 180°. The clearance height of the lower module edge above the ground is 0.7 meters at the lowland test site, and 1 meter at the mountain test site.
The front side contribution of the plane of array irradiance (GPOA) at the test sites are measured by heated pyranometers, and the module temperature (Tmod) is measured with a sensor attached to the backsheet of the modules. In addition to this, ambient temperature is also measured (Tamb). At the lowland test site rear-side irradiance is measured with a pyranometer without heating. Both test sites are monitored with a camera. Daily snow data are collected from seNorge.no and ERA5 [21]. SeNorge.no is provided by the Norwegian Water Resources and Energy Directorate and is based on weather models and local measurements [22,23]. The dataset has a horizontal resolution of 1 km. Hourly snow data from ERA5-Land [24] and the global reanalysis is collected through PVRADAR. The ERA5 data sets have a horizontal resolution of 9 km (land) and 31 km (global). Snow data for the two test sites from SeNorge.no is shown in Figure 2.
Overview of the datasets used in this work.
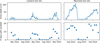 |
Fig. 2 Snow data for the two test sites from SeNorge.no. The upper figures show the daily snow depth for the analyzed periods, and the lower figures show the number of days per month with snowfall. |
2.2 Snow loss quantification
Quantification of measured snow loss is based on a comparison between measured output and modeled output in periods with snow on the ground. The output of the systems is modeled using the pvlib [25] implementation of the pvwatts DC power model [26] with plane of array irradiance and module temperature as input. For the bifacial array at the lowland test site the front side and rear-side irradiance are added to obtain the total plane of array irradiance. The mountain test site lacks rear side irradiance, and bifacial loss is therefore not quantified. For accurate quantification of snow losses, the system model should take into account all other losses than snow. To obtain this, a constant system loss value is estimated by comparing the model with measured data in snow free periods. The estimated system loss value is then multiplied with the output of the pvwatts DC power model. The main uncertainties of the described snow loss quantification method are snow accumulation on the pyranometers and potential winter-related losses that are not accurately accounted for by the constant system loss value, for example due to low irradiance, shading or high angle of incidence. As the pyranometers are ventilated, snow does not easily accumulate on the glass dome of the pyranometer. While shading in some cases can give high temporary losses, losses caused by low irradiance and high angle of incidence are typically low. These uncertainties will therefore in most cases lead to small absolute errors.
2.3 The Marion snow loss model
The estimated snow loss values are then used to test the Marion snow loss model [9], which has shown promising results for snow loss modeling with high time resolution for roof mounted systems [27] but is less validated for ground mounted systems. The model assumes snow accumulation and full snow coverage when there is snowfall over a certain threshold. Further, it assumes that the snow clears off the modules when the relation described in equation (1) is fulfilled. The m in equation (1) is an empirical coefficient estimated in the original publication. An empirical snow clearing coefficient (sc) and the module tilt (β) are used to estimate how fast snow clears of the module by estimating the fraction of the snow cover (S) that clears every hour (Sclear), as described in equation (2).
 (1)
(1)
 (2)
(2)
The snow accumulation part of the model and the impact of data quality is assessed for the lowland test site (A) by relating snowfall data points from the different data sets (ERA5-Land, ERA5 global, seNorge.no) to snow accumulation on the modules. The datapoints are assessed according to Table 2. Snow accumulation is identified from analysis of site images acquired from a camera monitoring the test site. The mountain test site is excluded from this analysis because the time series of image data is not complete. Events where the module goes from clear to fully covered are noted as a snow accumulation event. Snowfall data points where the modules already are covered by snow are not included as it is not possible to assess if the snowfall would fully cover the module.
In the modeling of losses, we use snowfall data from seNorge.no, as this source had a much lower rate of false positive snow fall values than the ERA5 datasets, shown in Section 3.1. The snow clearing coefficient in equation (2) is not widely validated. In the original publication of the Marion snow loss model [9] a value of 0.6 was estimated based on one datapoint. In this work, we use the snow clearing coefficient of 0.6 in the default pvlib implementation of the model. In pvlib, the snow clearing coefficient is named slide amount coefficient. However, as snow can clear off by other mechanisms than sliding, for example melting, we use the term snow clearing coefficient in this work. Relating snow coverage to actual power loss is challenging, as this will depend on the transmittance and shape of the snow coverage, how the snow coverage is distributed on the module relative to the bypass diodes, and how the inverter and maximum power point tracking reacts to shading in the system [28]. In this work we assume that the fraction of snow coverage is equal to the relative snow loss, as we don’t find the snow coverage estimations during partial cover to be accurate enough to give accurate power loss estimations. However, if we had accurate snow cover estimation this would lead to inaccurate results in the power loss estimations during partial snow cover. For example, a snow coverage of 5% would in this case give modeled power losses of 5%, but if a bypass diode is activated, the power losses would be 33%.
Assessment of snowfall data and snow accumulation on the modules.
3 Results
3.1 Snow accumulation
Figure 3 shows snowfall events from the snow data sources, and if the snowfall led to accumulation on the module or not for the lowland test site (A). The figure also shows if the snow data sources failed to predict snowfall and therefore also snow accumulation. For the Norwegian data source, seNorge.no, we observe that most snowfalls in the dataset gives snow accumulation on the modules (true positive). However, we detect multiple days with snow accumulation on the modules when there are no snowfalls in the dataset (false negative). These events are typically related to very small snowfalls giving only a thin cover of snow on the modules, suggesting that the resolution of the snow fall data is too coarse to capture all snow accumulation events. On the other hand, the false positives of this dataset are also related to small snowfalls, typically <1 cm, and/or temperatures around zero. Smaller snow falls are thus expected to give higher uncertainties in the input data, and also the modeling. For both the ERA5 land and global datasets, there are several snowfalls in the datasets that do not lead to snow accumulation (false positive). Similar to the SeNorge.no data, also these data points are typically linked to small snowfalls and/or temperatures above or around zero. There are more snowfall events for these sources, giving more data points in the figures. There are, however, no false negative events. ERA5 global gives much smaller snowfalls than registered at the site, likely linked to its larger spatial resolution which gives less accurate temperature estimations, and therefore also less accurate snowfall predictions. The high number of false positive data points in the ERA5 datasets is expected to give significant overestimation of snow losses in snow modeling, as 100% snow loss is assumed after each snow fall. A snowfall amount threshold can filter out most of the events that do not lead to snow accumulation. However, as observed in the figure, also small snowfalls can give accumulation, and there is no clear snowfall threshold between accumulation and no accumulation. The main challenge in estimation of snow accumulation appears to be snow data quality. For sites with local temperature data, we advise using the temperature data for filtering out times when snowfall is unlikely. As discussed in the introduction, snow accumulation on systems with very high/vertical tilt angles should be further studied.
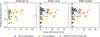 |
Fig. 3 Snowfall events from seNorge.no, ERA5-Land, and ERA5 global. The figure shows if the snowfall led to accumulation on the module or not, and if the snow data sources failed to predict snowfall and snow accumulation. |
3.2 Model validation
Figure 4 shows measured loss for the two systems. For the mountain test site only monofacial loss is shown due to a lack of backside irradiance measurements. Bifacial PV systems are commonly hypothesized to shed snow faster and have lower snow losses than monofacial systems, because the irradiance absorbed by the backside will heat the modules [3]. For the test sites in this study, however, this overall trend was not observed. As shown in Figure 4, the total energy lost for the bifacial modules at the lowland test site is similar, and sometimes even higher, compared to the losses of the monofacial modules, despite the back side contribution of the bifacial array. The monthly losses for the bifacial array are on average 0.2 percentage points higher than for the monofacial arrays. Figure 5 illustrates that, in some cases, snow clears first from the monofacial modules, while in other cases it clears first from the bifacial modules. This behavior, which contradicts common hypotheses, can be explained by the fact that the irradiance at the test site during periods with snow cover is typically very low, as shown in Figure 6. When the plane of array irradiance is low, the additional energy absorbed on the back side may be insufficient to promote snow clearing. The modules at the test sites have tilt angles of 30 and 45 degrees, giving good conditions for fast snow shedding, also for monofacial modules, limiting the conclusiveness of these observations. For the lowland test site, the bifacial modules are installed in landscape, while the monofacial modules are installed in portrait, which also can impact the difference in snow shedding between the arrays. However, similar trends are also observed at the mountain test site, where both the monofacial and bifacial modules are installed in portrait. For both test sites, the monofacial arrays experience more shading than the bifacial arrays, which is expected to reduce the snow shedding rate, indicating that the monofacial losses could have been even smaller. An additional error source which ca results in overestimation of the bifacial snow losses is that when only the back side is generating, there might be additional losses in the module related to the low irradiance, and in the inverter related to the low power.
Figure 7 shows modeled versus daily snow loss for the two monofacial arrays at the lowland test site, and for the monofacial array at the mountain test site. For most days at the lowland test site, the model accurately predicts lost energy. The RMSE between the modeled and measured daily values is 0.28. For the mountain test site, the figure shows larger errors. The RMSE between measured and modeled values for this test site is 0.69. At the lowland testsite, the largest errors are related to underestimation of the model. This occurs on days where the ambient temperature is around zero. At the mountain test site the model both under- and overestimates. Also here most of the largest errors can be related to temperatures around zero. The errors when the temperature is around zero can be related to errors in the input data (for example days where the snow data source fails to predict snowfall and snow accumulation, shown in Fig. 3). When the temperature is around zero, the precipitation can turn out as rain, snow or sleet. The snowfall model in the snow data sources can thus inaccurately predict rain when it is snowing, leading to errors in the prediction of snow accumulation. When the temperature is close to zero, snow shedding prediction is also more uncertain, as small changes in temperatures can lead to large differences in snow shedding. Figure 8 shows how measured snow loss is better correlated with modeled snow coverage for a period with low temperature and high irradiance than for a period with higher temperature and lower irradiance. Another significant factor leading to underestimation by the model is ground interference, which depends on clearance height of the array and the amount of snow on the ground. At test site B, camera observations show that large amounts of snow on the ground blocks snow shedding, giving slower snow clearing than predicted by the model. Increase in losses with increase in ground interference is in line with previous observations [6]. Shading is also expected to give increased uncertainties as this is not included in the irradiance value used for estimating snow clearing.
Figure 9 shows the measured and modeled yearly losses for the test sites. These numbers are lower than what has previously been reported for roof mounted systems in Norway and similar climates [29]. There are multiple climatic and system specific factors that can give variation in snow losses between systems. But a possible explanation for why the ground mounted systems studied in this work overall have lower losses compared to roof systems is that the snow more freely can shed from ground mounted systems. In the ground mounted systems, the modules are elevated above the ground making it possible for the snow to slide off in periods when the snow depth is not higher than the clearance height of the modules to the ground. In flat roof systems, the modules are typically mounted close to the roof, reducing the possibility of sliding. In residential systems on tilted roofs, snow sticking to the roof tiles with high friction can hold on to the snow on the PV modules due to the high cohesion of snow. Notably, the test site located in a subarctic climate in the mountains, experience almost 10 times higher yearly losses than the test site located in a more moderate climate in the lowlands. The difference in losses can be explained by the differences in snow conditions at the locations, illustrated in Figure 2. The mountain test site experiences both larger snow depths and a higher number of days with snowfall. This difference is site specific, and we expect to see larger variations within the same climate zone when more sites are analyzed. As in Figure 4, there are minimal differences between snow losses in the bifacial and monofacial system at Test site A. For both sites and PV technologies, the model gives excellent estimations of yearly snow losses, differing less than 0.5 percentage points from measured losses.
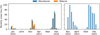 |
Fig. 4 Monthly snow loss measured for the lowland test site (A) (left) and the mountain test site (B) (right) for the complete time series analyzed for the two test sites. |
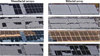 |
Fig. 5 Snow coverage on the studied arrays at the lowland test site. Images in the same row correspond to the same timestamp. |
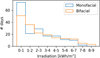 |
Fig. 6 Distribution of measured daily total POA irradiation for the monofacial and bifacial arrays (rear side irradiance included) at the lowland test site in periods with snow loss above 50%. |
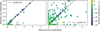 |
Fig. 7 Modeled vs measured daily snow loss for the two monofacial arrays at the lowland test site (left) and for the monofacial array at the mountain test site (right). |
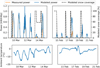 |
Fig. 8 Measured and modeled power together with modeled snow coverage for one of the monofacial arrays at the lowland test site (A) during a cold period with high irradiance (left) and during a warmer period with low irradiance (right). The modeled power shows the expected power without snow, and the difference between measured and modeled power is the snow loss. |
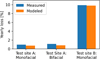 |
Fig. 9 Measured and modeled yearly snow loss for the studied test sites. Test site B: Bifacial is not included because of lacking back side irradiance measurements. |
4 Conclusion
The quantification of snow losses performed in this work indicates that ground mounted systems have lower snow losses compared to what have previously been documented for roof mounted systems in Norway and similar climates. Additionally, monofacial and bifacial arrays experienced similar losses. At the same test site, the bifacial array’s monthly losses were, on average, 0.2 percentage points higher than those of the monofacial array. The global weather snow data sources assessed (ERA5 land and global) had a large share of snowfall events not giving snow accumulation. These events were linked to both small snowfalls and higher temperatures. The default pvlib implementation of the Marion model typically underestimates losses, but the error in relative yearly losses is less than 0.5 percentage points. The error in the modeling is mainly related to periods where the temperature is close to zero, when both the snow input data and the prediction of snow shedding are more uncertain. For the test site located in a subarctic climate, ground interference due to large snow depths also leads to slower shedding and underestimation of losses in the model.
The measured losses and the difference between monofacial and bifacial arrays depend on local weather conditions and cannot be generalized to other systems with different conditions. However, the small difference in snow loss between monofacial and bifacial arrays at one of the sites studied in this work indicates that previous assumptions of significantly lower losses in bifacial systems do not always hold under all conditions. The model validation, on the other hand, can be generalized to other sites, although additional data from sites with varying configurations, especially tilt, and weather conditions would strengthen these conclusions.
Funding
This research was funded by The Research Council of Norway, through the project FME Solar 350244.
Conflicts of interest
The authors have nothing to disclose.
Data availability statement
The data associated with this article is not publicly available.
Author contribution statement
Mari B. Øgaard performed the analysis and wrote the original draft of the paper. Erling W. Eriksen and Thore Müller contributed to the data collection and processing. Sigrid Rønneberg contributed to the snow accumulation analysis. All co-authors participated in the planning of the work, discussion of results, and in the review and editing of text.
References
- R. E. Pawluk, Y. Chen, Y. She, Photovoltaic electricity generation loss due to snow – a literature review on influence factors, estimation, and mitigation, Renew. Sustain. Energy Rev. 107, 171 (2019), https://doi.org/10.1016/j.rser.2018.12.031 [CrossRef] [Google Scholar]
- D. Dahlioui, M.B. Øgaard, A.G. Imenes, Snow impact on PV performance: assessing the zero-output challenge in cold areas (Elsevier Ltd., May 01, 2025), https://doi.org/10.1016/j.rser.2025.115468 [Google Scholar]
- E. Lorenz, D. Heinemann, C. Kurz, Local and regional photovoltaic power prediction for large scale grid integration: assessment of a new algorithm for snow detection, Prog. Photovolt.: Res. Appl. 20, 760 (2011) [Google Scholar]
- K.S. Hayibo, A. Petsiuk, P. Mayville, L. Brown, J.M. Pearce, Monofacial vs bifacial solar photovoltaic systems in snowy environments, Renew. Energy 193, 657 (2022), https://doi.org/10.1016/j.renene.2022.05.050 [CrossRef] [Google Scholar]
- M. Beraki, M. Darnon, G. Hamon, J.F. Lerat, Performance and temperature comparison of photovoltaic modules in snowy conditions, in 2025 IEEE 53rd Photovoltaic Specialists Conference (PVSC) (2025), pp. 1155–1157, https://doi.org/10.1109/PVSC59419.2025.11132774 [Google Scholar]
- N. Heidari, J. Gwamuri, T. Townsend, J.M. Pearce, Impact of snow and ground interference on photovoltaic electric system performance, IEEE J. Photovolt. 5, 1680 (2015), https://doi.org/10.1109/JPHOTOV.2015.2466448 [CrossRef] [Google Scholar]
- E. C. Cooper, L. Burnham, J. Braid, Photovoltaic inverter-based quantification of snow conditions and power loss, EPJ Photovolt. 15, 6 (2024), https://doi.org/10.1051/epjpv/2024004 [Google Scholar]
- I. Frimannslund, T. Thiis, A. Aalberg, B. Thorud, Polar solar power plants – investigating the potential and the design challenges, Sol. Energy 224, 35 (2021), https://doi.org/10.1016/j.solener.2021.05.069 [Google Scholar]
- B. Marion, R. Schaefer, H. Caine, G. Sanchez, Measured and modeled photovoltaic system energy losses from snow for Colorado and Wisconsin locations, Sol. Energy 97, 112 (2013), https://doi.org/10.1016/j.solener.2013.07.029 [CrossRef] [Google Scholar]
- D. Riley, L. Burnham, P. Dice, J. Braid, An enhanced snow-shedding model: the module frame as a key variable, in 2023 IEEE 50th Photovoltaic Specialists Conference (PVSC), (2023), https://doi.org/10.1109/PVSC48320.2023.10359767 [Google Scholar]
- J. Ma, A. Khoury, M. Rodgers, Evaluation of PV snow loss models in the East Coast of Canada using AI computer vision, in 2023 IEEE 50th Photovoltaic Specialists Conference (PVSC) (2023), https://doi.org/10.1109/PVSC48320. 2023.10360003 [Google Scholar]
- R. Pfister, M. Schneebeli, Snow accumulation on boards of different sizes and shapes, Hydrol. Process. 13, 2345 (1999) [Google Scholar]
- V. Shekar, A. Caló, E. Pongrácz, Experiences from seasonal Arctic solar photovoltaics (PV) generation- an empirical data analysis from a research infrastructure in Northern Finland, Renew Energy 217, 119162 (2023), https://doi.org/10.1016/j.renene.2023.119162 [Google Scholar]
- A. Granlund, J. Narvesjö, A.M. Petersson, The influence of module tilt on snow shadowing of frameless bifacial modules, in EUPVSEC proceedings (2019) [Google Scholar]
- E. Tonita, S. Ovaitt, H. Toal, K. Hinzer, C. Pike, C. Deline, Vertical bifacial photovoltaic system model validation: study with field data, various orientations, and latitudes, IEEE J. Photovolt. 15, 600 (2025), https://doi.org/10.1109/JPHOTOV.2025.3561395 [Google Scholar]
- J. Heil, B. Mohammadian, M. Sarayloo, K. Bruns, H. Sojoudi, Relationships between surface properties and snow adhesion and its shedding mechanisms, Appl. Sci. 10, 5407 (2020), https://doi.org/10.3390/APP10165407 [Google Scholar]
- T. Eidevåg, E.S. Thomson, D. Kallin, J. Casselgren, A. Rasmuson, Angle of repose of snow: an experimental study on cohesive properties, Cold Reg. Sci. Technol. 194, 103470 (2022), https://doi.org/10.1016/j.coldregions.2021.103470 [Google Scholar]
- S. Rønneberg, C. Laforte, C. Volat, J. He, Z. Zhang, The effect of ice type on ice adhesion, AIP Adv. 9, 055304 (2019), https://doi.org/10.1063/1.5086242 [Google Scholar]
- M. Ross, Snow and ice accumulation on photovoltaic arrays: an assessment of the TN conseil passive melting technology (Varennes, 1995) [Google Scholar]
- H.E. Beck, N.E. Zimmermann, T.R. McVicar, N. Vergopolan, A. Berg, E.F. Wood, Present and future köppen-geiger climate classification maps at 1-km resolution, Sci. Data 5, 180214 (2018), https://doi.org/10.1038/sdata.2018.214 [Google Scholar]
- H. Hersbach et al., The ERA5 global reanalysis, Q. J. R. Meteorol. Soc. 146, 1999 (2020), https://doi.org/10.1002/qj.3803 [Google Scholar]
- T.M. Saloranta, Simulating snow maps for Norway: description and statistical evaluation of the seNorge snow model, Cryosphere 6, 1323 (2012), https://doi.org/10.5194/tc-6-1323-2012 [Google Scholar]
- T.M. Saloranta, Operational snow mapping with simplified data assimilation using the seNorge snow model, J. Hydrol. 538, 314 (2016), https://doi.org/10.1016/j.jhydrol.2016.03.061 [Google Scholar]
- J. Muñoz-Sabater et al., ERA5-Land: a state-of-the-art global reanalysis dataset for land applications, Earth Syst. Sci. Data 13, 4349 (2021), https://doi.org/10.5194/essd-13-4349-2021 [Google Scholar]
- K.S. Anderson, C.W. Hansen, W.F. Holmgren, A.R. Jensen, M.A. Mikofski, A. Driesse, pvlib python: 2023 project update, J. Open Source Softw. 8, 5994 (2023), https://doi.org/10.21105/joss.05994 [Google Scholar]
- A.P. Dobos, PVWatts version 5 manual, Report NREL/TP-6A20-62641, 2014, https://doi.org/10.2172/1158421 [Google Scholar]
- M.B. Ogaard, I. Frimannslund, H.N. Riise, J. Selj, Snow loss modeling for roof mounted photovoltaic systems: improving the marion snow loss model, IEEE J. Photovolt. 12, 1005 (2022), https://doi.org/10.1109/JPHOTOV.2022.3166909 [Google Scholar]
- M.B. Øgaard, B.L. Aarseth, Å.F. Skomedal, H.N. Riise, S. Sartori, J.H. Selj, Identifying snow in photovoltaic monitoring data for improved snow loss modeling and snow detection, Sol. Energy 223, 238 (2021), https://doi.org/10.1016/j.solener.2021.05.023 [CrossRef] [Google Scholar]
- M.B. Øgaard, H.N. Riise, J.H. Selj, Estimation of snow loss for photovoltaic plants in Norway, in Proc. 38th Eur. Photovolt. Sol. Energy Conf. (2021) [Google Scholar]
Cite this article as: Mari B. Øgaard, Erling W. Eriksen, Dounia Dahlioui, Sigrid Rønneberg, Thore Müller, Heine N. Riise, Analyzing and modeling snow loss and snow loss accumulation in ground-mounted photovoltaic systems, EPJ Photovoltaics 17, 9 (2026), https://doi.org/10.1051/epjpv/2026004
All Tables
All Figures
|
Fig. 1 Number of days with snowfall in 2024. Data from Copernicus Atmosphere Monitoring Service, 2025. |
| In the text | |
|
Fig. 2 Snow data for the two test sites from SeNorge.no. The upper figures show the daily snow depth for the analyzed periods, and the lower figures show the number of days per month with snowfall. |
| In the text | |
|
Fig. 3 Snowfall events from seNorge.no, ERA5-Land, and ERA5 global. The figure shows if the snowfall led to accumulation on the module or not, and if the snow data sources failed to predict snowfall and snow accumulation. |
| In the text | |
|
Fig. 4 Monthly snow loss measured for the lowland test site (A) (left) and the mountain test site (B) (right) for the complete time series analyzed for the two test sites. |
| In the text | |
|
Fig. 5 Snow coverage on the studied arrays at the lowland test site. Images in the same row correspond to the same timestamp. |
| In the text | |
|
Fig. 6 Distribution of measured daily total POA irradiation for the monofacial and bifacial arrays (rear side irradiance included) at the lowland test site in periods with snow loss above 50%. |
| In the text | |
|
Fig. 7 Modeled vs measured daily snow loss for the two monofacial arrays at the lowland test site (left) and for the monofacial array at the mountain test site (right). |
| In the text | |
|
Fig. 8 Measured and modeled power together with modeled snow coverage for one of the monofacial arrays at the lowland test site (A) during a cold period with high irradiance (left) and during a warmer period with low irradiance (right). The modeled power shows the expected power without snow, and the difference between measured and modeled power is the snow loss. |
| In the text | |
|
Fig. 9 Measured and modeled yearly snow loss for the studied test sites. Test site B: Bifacial is not included because of lacking back side irradiance measurements. |
| In the text | |
Current usage metrics show cumulative count of Article Views (full-text article views including HTML views, PDF and ePub downloads, according to the available data) and Abstracts Views on Vision4Press platform.
Data correspond to usage on the plateform after 2015. The current usage metrics is available 48-96 hours after online publication and is updated daily on week days.
Initial download of the metrics may take a while.