| Issue |
EPJ Photovolt.
Volume 16, 2025
Special Issue on ‘EU PVSEC 2024: State of the Art and Developments in Photovoltaics’, edited by Robert Kenny and Gabriele Eder
|
|
|---|---|---|
| Article Number | 12 | |
| Number of page(s) | 12 | |
| DOI | https://doi.org/10.1051/epjpv/2024046 | |
| Published online | 16 January 2025 | |
https://doi.org/10.1051/epjpv/2024046
Original Article
Benchmarking equivalent circuit models for the IV characteristic of bifacial photovoltaic modules
Technical University of Denmark, Department of Electrical and Photonics Engineering, Roskilde, Denmark
* e-mail: This email address is being protected from spambots. You need JavaScript enabled to view it.
Received:
30
June
2024
Accepted:
28
November
2024
Published online: 16 January 2025
Abstract
Modelling the current–voltage (IV) characteristic curve of photovoltaic (PV) modules can give valuable insight into the state of health of the PV modules by estimating equivalent circuit parameters, and be used for fault detection in conjunction with IV-based condition monitoring of PV modules, strings and arrays. The most prevalent approach to approximate the IV curve of bifacial solar devices is to model a single diode equivalent circuit model (ECM) with two photo-current sources, representing the front and the back side. This approach is implemented in the main PV modelling software with various methods to parameterize the model. In this work we benchmark the most common ECM models for bifacial devices, using pvlib-python, against module level IV curves measured with an outdoor measuring system. We record IV measurements on eight current-generation bifacial PV modules with PERC-type cells, covering the range of temperature and irradiance conditions over a full year in the Danish climate. The modelling uses datasheet specifications as that is the most widely available input. Results show normalized mean bias errors between −0.71% and 4.09% and normalized root mean squared errors between 1.62% and 9.76% across Pmp, Isc and Voc, with Voc exhibiting the lowest estimation errors. All models show weaknesses in the irradiance and temperature dependence at Isc. The CEC and PVsyst model have an improved temperature and irradiance dependency at Voc compared to the DeSoto model, which performed better at estimating Pmp. While the models characterize the Vmp/Voc ratio well, they fail to cover the wide range of Imp/Isc ratios seen in measurements. We found the generic datasheet parameters used for model parametrization to be overestimated compared to flash tests, which contributed to the modelling error. Using non-module specific inputs also meant that results vary significantly for different modules of the same type. A monofacial module showed on par or worse modelling results compared to bifacial modules, validating the modelling approach of a combined effective irradiance for the front and back side.
Key words: Equivalent circuit model / IV characteristic / bifacial PV / current–voltage / pvlib
© M. Bartholomäus et al., Published by EDP Sciences, 2025
 This is an Open Access article distributed under the terms of the Creative Commons Attribution License (https://creativecommons.org/licenses/by/4.0), which permits unrestricted use, distribution, and reproduction in any medium, provided the original work is properly cited.
1 Introduction
Modelling the performance of solar photovoltaic (PV) modules is essential to obtain realistic yield estimates during PV plant design and operation. In particular, modelling the full current–voltage (IV) curve is necessary for current and voltage sizing of the PV inverter, can give valuable insight into the state of health of the PV modules [1] and be used for fault detection in conjunction with IV-based PV condition monitoring [2,3]. While modelling the IV characteristic curve of monofacial PV devices is well understood, modelling IV curves of bifacial PV modules requires modifications to those models due to the function of the rear side as a current source. One challenge is modelling the increased cell mismatch due to shading on the rear side, as well as the temperature behaviour of bifacial modules, due to the bifacial nature of the device, which has been addressed in previous research [4,5]. Another challenge of bifacial PV device modelling is the accurate measurement or estimation of rear irradiance of the modules [6]. The main approach for modelling the IV characteristic curve of bifacial PV devices is to deploy an equivalent circuit model, specifically the single-diode-model (SDM), while adding the rear in-plane irradiance weighted with the bifaciality factor to the front side irradiance [4,5,7]. The most popular modelling software used in the industry, such as System Advisor Model (SAM) [8], PVsyst [9] and pvlib [10] use this approach. These SDM-based models differ in the way the model parameters are calculated, and the underlying assumptions made, such as for irradiance or temperature dependencies of the PV device. Here the main methods are by PVsyst [11], the California Energy Commission (CEC) [12], which is utilized in SAM, and DeSoto [13], which are all implemented in the popular modelling platform pvlib-python [14] as well. However, differences in the assumptions for model parametrization methods are not connected to modelling the bifaciality of the modules (in all cases, modellers simply assume two current sources).
Some models only estimate power at the maximum power point (Pmp) or at a few characteristic points such as Voc, Isc, Pmp and additional points on the IV curve, such as the Sandia model by King et al. [15]. The same applies for the model developed by Singh et al. [16], which was also only validated on single-side illumination data. Other modellers used known measured IV curves of monofacial solar modules, such as Janssen et al. in [17], who modelled the IV characteristic of bifacial PV modules by scaling and weighting two-diode parameters obtained from monofacial front and rear module IV curves measured at standard testing conditions (STC) to obtain the IV characteristic of the bifacial device at other operating conditions. Bouchakour et al. adapted monofacial models to characterize bifacial modules, one of which can reflect a full IV curve, but only show a validation of the Pmp output [18].
A comprehensive modelling validation work was recently published by Deville et al., who benchmarked open-source PV performance models against measured data from seven PV systems in Albuquerque [19]. They employed a similar methodology to this work and included irradiance, temperature and electrical modelling in their assessment, but focused on monofacial PV systems and Pmp data.
Our literature search found that the most commonly used models for estimating the IV curves of bifacial PV devices used today are adapted from models of monofacial PV devices using simple assumptions to account for solar cell/module bifaciality. Furthermore, a comprehensive comparison of current models for bifacial IV characteristics against each other could not be found in the literature. This work provides a comparison of three of the most popular electrical models available in pvlib-python that can estimate the full IV characteristic of bifacial PV modules. We perform the comparison using one year of recorded irradiance, temperature, and IV measurements on eight current-generation PV modules deployed in Denmark using an outdoor module-level IV tracing system. Since in practice, modellers rarely have access to module specific input data, we parametrize the models on datasheet specifications. We thereby aim to answer the research question, how accurately modellers are able to reproduce the full IV curve of PV modules under the limitation that datasheet specifications are used. We analyze the modelling error at Pmp, Isc and Voc as well as for the Imp/Isc and Vmp/Voc ratios, which are indicators of the curve shape and can be utilized for fault detection purposes. This work presents novel insights into the practical application of IV curve models for bifacial PV modules, which have not been reported in the literature before. We examine the differences of the models and establish benchmark numbers for what modelling errors modellers should expect when reproducing measured IV curves of bifacial modules in the field.
2 Methods
2.1 Outdoor experimental setup
The PV modules utilized for this modelling comparison are deployed at the Technical University of Denmark's Risø¸ campus, Denmark (lat. 55.7°, long. 12.1°). They are installed on a south-facing fixed tilt array with a tilt angle of 25° in a 1-panel layout, with 2 m ground clearance on average (at the torque tube) and grass ground cover. The PV array has a row behind it (7.5 m row-to-row distance) but not in front of it.
Module IV curves of eight individual PV modules are recorded using two EKO PV Blocks measurement systems [20]. We use the following naming convention to refer to the modules: Modules A1 and A2 are deployed on a 2-channel EKO system, whereas modules B1, B2 and B3 as well as C1, C2 and C3 are deployed on a 9-channel measurement system. Figure 1 shows the 9-channel measurement setup and the deployment of the modules. The 2-channel system has a very similar layout, which is described in detail in [6]. The EKO systems are physically (but not electrically) integrated into an array of PV modules of similar size, which surround the measurement system and prevent edge-brightening effects from both sides. Three modules on the 9-channel system were omitted because of edge-brightening on the rear irradiance as they were not covered by modules at their side.
Each PV module is connected to a load and has its IV curve measured every five minutes since the deployment of the system in April 2023. The IV measurement unit complies with IEC 60904-1:2020, which demands physical measurements of Isc and Voc with an uncertainty of at most ±0.2%. Between measurements, the modules are operated at open circuit voltage because the high-power modules (545–600Wp) would frequently reach the loads' power dissipation limitations if operated at the maximum power point.
An individual Pt-100 resistance temperature detector (RTD, measurement error ±0.15 °C) is connected to each module to measure backside module temperature, with the exception of module B1, for which we use the temperature sensor of B2. On the 9-channel system, we deployed a front irradiance sensor (EKO MS-80S pyranometer, ISO 9060:2018 Class A, spectrally flat & fast response) in the plane of array of the system to measure the irradiance in the plane of array (GPOA) and an EKO MS-40S pyranometer (ISO 9060:2018 class C, spectrally flat) on the backside 50% up from the center torque tube to measure rear irradiance in the plane of array (RPOA). On the 2-channel system, we use an EKO MS-40M pyranometer (ISO 9060:2018 Class C, spectrally flat) for GPOA and an IMT Si-420 reference cell (measurement error ±3.0W/m2 between 100–1500 W/m2, 4.5 W/m2 below) on the backside for RPOA, placed 30% below the center torque tube. The rear irradiance sensor placement on both systems follows recommendations resulting from previous work done on the same PV array, which also accounts for the thick center torque tube of the support structure [6]. Two sets of irradiance sensors were necessary because sensor readings are only saved upon an IV measurement, and the two systems are not synchronized.
Additionally, global horizontal irradiance (GHI), diffuse horizontal irradiance (DHI), and direct normal irradiance (DNI) are measured at DTU's on-site weather station.
The PV modules deployed on the system are of different types. Data are available for three different bifacial half-cut PERC module types with aluminum frames, which all became commercially available in 2021 or later (aged 1 to 3 years).
The rated power ranges from 545 Wp to 600 Wp. On the 2-channel system, two identical modules are deployed, one of which (A1) is made monofacial by applying a rubber coating on the back side. Table 1 lists relevant information about the PV modules used in this study.
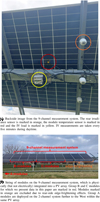 |
Fig. 1 Outdoor PV module IV measurement system deployed Risø, DTU. |
PV module datasheet specifications of the three module types used. Repeated module types are deployed side by side and are measured and modelled separately. Module A1 is made monofacial by applying a rubber cover on the back side.
2.2 Measured data used for model benchmarking
The measurements were taken from April 2023 for one full year, representing all seasons of the Danish climate. The conditions span a range of up to GPOA,max = 1027.2 W/m2 (after removing outliers above the third quartile plus 1.5 times the inter-quartile range) and −15 ° C < Tmod < 60.9 ° C) and are shown in Figure 2, where each temperature sensor is plotted along with the GPOA and RPOA sensors.
It can be observed that the temperature behaviour is similar for all modules with a small spread. Differences between temperature readings on different modules are expected as module temperature is influenced by various factors such as differences in module types, cell and module mismatch, or uneven soiling of the modules. The monofacial module A1 displays higher temperature values than its bifacial counterpart, A2, likely caused by the added rear side insulation from the rubber coating. Module B1 uses the temperature sensor of B2 due to missing data for that period, but as they are identical modules, the approximation is reasonable.
The two front irradiance sensors have a mean bias error of 10.24 W/m2 (of the sensor of the 9-channel-system) between them over the whole year (RMSE = 67.49 W/m2). They are mounted to the same plane of the array, but differences might be due to the different sensor classes and calibration, measurement uncertainty, different angular response, or slight variation in their positioning.
The rear irradiance sensors show very similar readings at a mean bias error of MBE = –5.23 W/m2 (of the sensor of the 9-channel-system) at a nRMSE of 11.34 W/m2. Small differences are expected due to differences in the sensor placement (above or below the torque tube, distance to the torque tube), ground cover, distance from the row edge, etc. These differences are observed before any filtering.
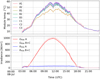 |
Fig. 2 Example of measured module temperatures, GPOA and RPOA irradiance acquired by the system in Figure 1, for a clear sky day (July 8th, 2023). |
2.3 Modelling the IV characteristic curve of bifacial PV modules
Three models are compared in this work and benchmarked on measured outdoor module-level IV curves. Figure 3 shows a flowchart of the modelling chain to estimate the IV curves of bifacial modules. Generally, the inputs are measured values of global horizontal irradiance, direct normal irradiance, diffuse horizontal irradiance, RPOA and GPOA, back-of-module temperature, and PV module/system-specific inputs, including datasheet specifications such as the STC electrical parameters, bifaciality and temperature coefficients.
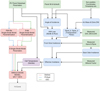 |
Fig. 3 IV characteristics modelling flowchart. The irradiance modelling chain is marked in blue, temperature modelling in purple and the electrical modelling chain in red. |
2.3.1 Electrical modelling
The module IV characteristics are modelled as an equivalent circuit single diode model with two current sources following [4]. All models are trained on datasheet specifications as that is the most widely available input for PV engineers in PV plant design, performance assessment, and fault detection. It is, therefore, of interest to assess how accurate these models are. Deville et al. point out that using system-specific modelling input such as flash test measurements greatly improves the modelling accuracy and may be more important than model selection for modelling the maximum power point of monofacial PV systems [19]. However, it is uncommon in situations outside of PV laboratories to have access to such data.
Three parametrization approaches are used: DeSoto [13], CEC [12] and PVsyst [11]. For the DeSoto model, the pvlib function “sdm.fit_desoto” was used, where the convergence criteria (‘xtol’) needed to be adjusted to a wider range in order to make the model converge. An xtol of 1.9e-3 was used for the group A modules, an xtol of 3.7e-3 for group B, and 1.8e-3 for group C. Else, default values were used for all parameters. The pvlib function for the CEC model (“sdm.fit_cec_sam”) was applied without modification. For the PVsyst [11] model, the PVsyst software was used for model fitting, and the results were exported to python using PAN files, as the PVsyst fitting method in pvlib-python (“sdm.fit_pvsyst_sandia”) [21] uses measured IV curves. Apart from the here mentioned modifications, the parametrization always used default parameters. The models each use a slightly different set of input parameters, but commonly use datasheet IV parameters (such as Isc, Voc, Imp and Vmp) and temperature coefficients.
The single diode equation is subsequently solved with the corresponding pvlib-python “pvsystem.calc_params” function and the resulting five parameter values are used with pvlib-pythons “singlediode” to simulate IV curves at 100 points per curve.
2.3.2 Optical modelling
To model the bifacial behaviour, the rear irradiance weighted by the module bifaciality is added to the front irradiance to obtain total irradiance as described by Equation (1), to account for the two photocurrent sources.
 (1)
(1)
where GPOA,corr is the measured front side irradiance corrected by incidence angle modifier (IAM) losses, bifi is the bifaciality of the module per datasheet specification and RPOA is the measured rear side irradiance. This is essentially equal to modelling two identical SDM circuits for the front and the back side, with respective irradiance inputs and weighting the backside contribution with the bifaciality factor. One module is monofacial, therefore rear irradiance was not added to its effective irradiance.
Whereas for the rear irradiance measurements, the sensor readings can be used directly, the front side irradiance in the plane of array, GPOA,meas, is corrected by IAM losses, which are modelled using the Martin & Ruiz model [22]. The IAM loss needs to be applied only to the direct irradiance component of the irradiance in the plane of array, GPOA, direct. This direct component is estimated with the Perez [23] transposition model, using GHI, DNI and DHI measured at DTU's on-site weather station, as well as modelled Air Mass (AM) from [24] and extra terrestrial radiation from [25]. The modelled IAM loss on the direct component is then subtracted from the measured plane of array irradiance of the pyranometer, following Equation (2).
 (2)
(2)
2.4 Temperature modelling
Module temperature measured on the backside is converted to cell temperature using the relation established in Equation (12) of the Sandia Model by King et al. [14] for open rack glass-cell-glass modules. The cell temperature is then used as a modelling input.
2.5 Measurement data filtering
Light measurement data filtering was done with the aim of removing outliers due to measurement failures or external events (for example, due to fast-changing irradiance during the sweep, failed measurements, snow, and shade while leaving the range of conditions as broad as possible. Data was filtered for physical limits of irradiance and module temperature. Last, a solar elevation filter was applied to filter nighttime, early morning, and late evening data due to the known limitation of irradiance sensors to be inaccurate at low irradiance or high angle of incidence (AOI), as well as horizon shading occurring at these times. A summary of the measurement data filters used are presented below:
GHI >– 4W/m2

−40 °C <Tmod < 85 °C
Solar elevation > 10°
Entries with NaN values
Pmp > 0 W
Fill factor > 70%
0.85 < Imp/Isc < 1
0.8 < Vmp/Voc < 1
GPOA/Isc > 130 W/m2/A.
This leaves at least 18,126 IV curves (B1) and at most 30,454 (C2) measured and simulated curves per module.
2.6 Error measures
The normalized mean bias error (nMBE) and normalized root mean squared error (nRMSE) between modelled and measured IV curves are calculated with Equations (3) and (4), respectively, to assess modelling results at selected IV curve points such as Voc, Pmp and Isc:
nMBE:
 (3)
(3)
nRMSE:
 (4)
(4)
where Mi is the modelled parameter (f.x. Pmp, Isc, Voc, etc.), Oi is the equivalent observed parameter, i denotes the observation index (one for each IV curve), and N is the total number of observations. Whereas the nMBE (in the following referred to as “bias”) gives a quantification of whether a model over- or underestimates on average, the nRMSE measures how far off the estimated parameter is from the measured value on average, without over- and underestimation cancelling each other out, therefore showing a measure of the variance of the error.
3 Results
3.1 Evaluation of datasheet specifications versus flash test data
We first assess the deviations of the modules datasheet specifications from indoor flash test measurements. Measurements were performed with an Endeas Quicksun 540XLi large area solar simulator (accuracy class AAA per IEC 60904-9 Ed.1). We performed flash tests before the module deployment, recording three IV sweeps per module at STC and used the average. Figure 4 shows the deviations, where positive values mean that the datasheet specifications are overestimated.
The datasheet parameters show the largest overestimations at Isc and the bifaciality factor, while the deviations are smaller for Pmp and smallest at Voc. It is reasonable to foresee that the error of the datasheet contributes to the modelling error and models would perform better if they had been parameterized with flash test specifications. However, since the estimation of some modelling inputs, such as the temperature coefficients for current, voltage and power requires IV measurements at a range of temperatures only achievable with specialized laboratory equipment such as a climate chamber, it is hardly possible to circumvent using datasheet parameters entirely.
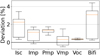 |
Fig. 4 Deviation of datasheet specifications versus flash test measurements of the eight modules included in this study. Shown are 5 relevant points on the IV curve and the bifaciality factor. Flash tests were done with an Endeas Quicksun at STC before module deployment. |
3.2 Modelling errors
Overall errors of each model at Pmp, Isc and Voc are displayed in Table 2, calculated as an average of all bifacial modules. Positive bias values mean an overestimation by the respective model.
We observe normalized MBEs of −0.71 to 4.09% at Pmp, with a significant difference between models, that however show similar nRMSEs of 9.3 to 9.76%. The Isc estimation resulted in a nMBE of 2.54 to 3.13% and a nRMSE of 8.27 to 8.5% with all models closely together. Voc is estimated with the lowest errors at both nMBE (0.17 to 1.54%) and nRMSE (1.62 to 3.08%). In the following sections we will explore the estimation error at each IV parameter in more detail, by analyzing differences between modules as well as irradiance and temperature dependence.
Modelling error of each model at Pmp, Isc and Voc as an average of all bifacial modules. All values are given in %.
3.3 Modelling the maximum power point
Figure 5 shows the modelling results with regards to Pmp for all considered PV modules and ECM models investigated. Figure 5a shows the error space between nRMSE and nMBE, whereas Figure 5b depicts the relative differences between modelled and measured IV curves (equal to the normalized residuals), calculated based on Pmp. Positive residuals and bias values mean an overestimation by the model.
For Pmp, the estimation erros can be clustered by model. The CEC and PVsyst models behave very similarly at a positive bias of 1.5 to 8%, showing that they are overestimating Pmp, while the DeSoto model displays a very small bias (–2% to 1%) at a lower nRMSE on average. As we have previously discussed, the datasheet specifications on Pmp are overestimated by about 1–2% and the bifaciality factor by up to around 4%, which drives models towards overestimations.
The trend of high or low bias or nRMSE is module-dependent, the same module seems to have high or low bias/nRMSE within each model. For example, A-modules tend to have nRMSEs on the high side within each model. Next to inaccurate datasheet specifications on these modules, the higher deviations are likely caused by degradation, as the A-modules have been fielded 1.5 years longer than modules from group A and B.
Within each model, the Pmp estimate of the group C clusters closely together, similarly modules B2 and B3. B1 displays higher nRMSEs compared to its group peers which is likely caused by the fact that it does not have its own temperature sensor. The A-modules are also spread far apart. This demonstrates that model parametrization on non-module-specific data, such as datasheet values, does not account for module-specific differences (e.g. power mismatch) of modules of the same make.
The Pmp estimation results of the monofacial module display the highest nRMSE and, except for the DeSoto model, nMBE within each model group. We do not attribute the higher errors to the modifications made to the module, as they are reflected in the modelling by eliminating the rear irradiance and measuring the module temperature. We therefore deem the model for this module comparable to the bifacial models. Hence, we draw the conclusion that the bifacial assumption is sufficient for modelling Pmp, making the bifacial modelling at least on par with equivalent models for Pmp of monofacial modules. It is not adding significant additional error to the modelling. Deville et al. report on Pmp modelling of monofacial modules and found a much smaller normalized bias (±0.75%) and nRMSE (4.4 to 4.6%) for monofacial PV systems modelled with the same modules. However, they use system-specific parametrization inputs from flash test data instead of datasheet values and filtered data points with a solar elevation of less than 15-degree elevation instead of 10, like in this work.
The cell temperature and irradiance dependencies of Pmp are shown in Figure 6, where the results of all modules are averaged. The CEC and PVsyst model behave similarly, where the modelling error increases with effective irradiance to a maximum of around 7.5%. While the CEC model has higher errors at less than approximately 400 W/m2, the two models are essentially equal for irradiance above that. On the other hand, the DeSoto model displays a much lower, negative bias that is stable except for the highest and lowest irradiances. For the very common application of Pmp modelling, especially the higher irradiance range is of importance. In this range, the DeSoto model shows to be most suitable.
The three models exhibit a high error at the lowest temperatures, which is likely due to snowfall that has not been filtered. With increasing temperature, the normalized bias error drops quickly to under 5%. From there, the CEC and PVsyst models show a stable, slightly increasing trend, whereas the DeSoto model has a downward trend, reaching negative bias at high temperatures. This reveals that the CEC and PVsyst models have accurate temperature behaviour at Pmp of bifacial modules outside of the highest and lowest module temperatures and apart from a constant positive bias, present an improvement compared to the DeSoto model. In addition, datasheet specifications of temperature dependence are sufficient to accurately model the temperature behavior of bifacial modules at Pmp.
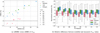 |
Fig. 5 Modelling error for Pmp. a) nRMSE versus nMBE from modelled IV characteristic. Individual modules are marked with unique symbols and the models have dedicated colors. b) Relative differences between modelled and measured Isc, Pmp and Voc values separated by modules. Colors represent models. |
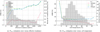 |
Fig. 6 Influence of effective irradiance (a) and cell temperature (b) on the nMBE of Pmp for each of the models as an average of all modules. |
3.4 Modelling short circuit current
Figure 7 shows the modelling results with regards to Isc. On estimating bifacial module Isc, the three models perform very similarly, reaching nMBEs of 0.5–4.5% and a nRMSE of 7–9.5%, which is less compared to Pmp for both metrics. The CEC and PVsyst model are almost identical, whereas the DeSoto is within 1% apart from the others, displaying a slightly larger positive bias and higher nRSME on two of the three PV module types. The over-estimation of Isc (and partly, Pmp) of the models may be influenced by the fact that no degradation, soiling or wire resistance losses were considered. In addition, the datasheet parameters used for model calibration are overestimated on Isc (median = 2.2%) and the bifaciality factor, which partly accounts for the overestimations of the models.
Results also cluster around the module types; Modules of type C show a higher bias error than the other ones but are close together. Modules of type B show a lower bias error and normalized RMSE than the other modules but are spread further apart from each other, similar to the Pmp.
The monofacial module shows the highest normalized RMSE of all modules, but an average normalized bias (2%) compared to all modules. As Isc is very irradiance dependent, this result emphasizes that the assumptions made for bifacial modelling, which are entirely connected to the effective irradiance modelling also hold for the estimation of Isc.
Figure 8 shows the Isc modelling error dependencies to effective irradiance and solar cell temperature. The Isc modelling error increases with effective irradiance independent of the model, showing a consistent trend. Upon further inspection, we found that this trend is very similar on all modules, which leads us to believe it is not caused by module degradation. Similarly, we investigated the bifaciality factor and found only marginal improvements when lowering bifaciality − lowering bifaciality to as much as 50% shifts the curves downwards by about 1%, but maintains their slope. Even applying a linear loss factor to effective irradiance does not change the slope, but rather shifts it downwards. When observed over the operating cell temperature range, it reveals that very high errors occur at the lowest observed cell temperature. Besides this phenomenon, which is likely caused by unfiltered snow-events, the error increases with temperature, in a similar trend between the models. It reveals all models significantly misjudge the irradiance and temperature dependency of Isc.
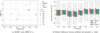 |
Fig. 7 Modelling error for Isc. a) nRMSE versus nMBE from modelled IV characteristic. Individual modules are marked with unique symbols and the models have dedicated colors. b) Relative differences (=nMBE) between modelled and measured Isc, Pmp and Voc values separated by modules. Colors represent models. |
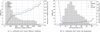 |
Fig. 8 Influence of effective irradiance (a) and cell temperature (b) on the nMBE of Isc for each of the models. |
3.5 Modelling open circuit voltage
For estimating the Voc of bifacial PV modules (Fig. 9), there is a much tighter error distribution for the PVsyst and CEC models compared to the DeSoto, which is also reflected in the nRMSE. The models show a small positive bias in the −1 to 3% range on average, with the DeSoto model resulting in the smallest average bias. The monofacial module displays the highest bias within each model (second highest in DeSoto) and displays the highest nRMSE for CEC and PVsyst. However, its bifacial counterpart displays similar errors, so we are not contributing the error to the modelling assumptions.
The Voc estimation errors of module type C, are close together within each model, just like for Pmp and Isc, whereas the other module groups are more spread out from each other. PVsyst and CEC behave similarly on a module by module based comparison, whereas the DeSoto model forms its own cluster in the sense that it has a high nRMSE (with a lower spread) and shows the lowest average bias in Voc (similar to Pmp) but a higher normalized RMSE). The reasons for this behaviour become apparent when analyzing the temperature and irradiance dependencies of the models.
Figure 10 shows the temperature and irradiance dependencies of Voc. The open circuit voltage modelling error is approximately 2% for all models, under low effective irradiance. With increasing irradiance, the models behave differently, where CEC and PVsyst are similar and show slightly decreasing errors, whereas the DeSoto model has a stronger negative trend reaching down to −4%.
Unlike Pmp and Isc, Voc is not affected in the low-temperature range, which also indicates that partial shade due to snow occurred at very-low temperature data (the Ppm > 0 filter excludes all IV curves impacted by total shade, but Voc should not be affected when the module is only partially shaded). Again, the DeSoto model has a different slope compared to the other two models, displaying improved temperature dependency of the CEC and PVsyst models at Voc as well. This curve shows a low error bias at 25 °C but overestimates Voc at lower and underestimates it at higher temperatures. This is likely responsible for the further spread and higher nRMSE values of the DeSoto model. The DeSoto bias is low overall because it is both over-and underestimating, depending on the irradiance and temperature conditions, so positive and negative residuals average out.
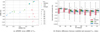 |
Fig. 9 Modelling error for Voc. a) nRMSE versus nMBE from modelled IV characteristic. Individual modules are marked with unique symbols and the models have dedicated colors. b) Relative differences between modelled and measured Isc, Pmp and Voc values separated by modules. Colors represent models. |
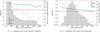 |
Fig. 10 Influence of effective irradiance (a) and cell temperature (b) on the nMBE of Voc for each of the models. |
3.6 Modelling current and voltage ratios
We assess the current and voltage ratios, Imp/Isc and Vmp/Voc, as indicators of the slopes of the modelled and measured IV curves. That is of interest, because a model estimating these ratios accurately as a function of ambient conditions can be utilized to detect module degradation, soiling or shading in the field. It has been previously shown that the Imp/Isc relation of bifacial modules can be influenced for example by partial shading [26]. Figure 11 shows the measured and modelled ratios for each of the models on data from module A2.
The Vmp/Voc ratio is following the unity line to a certain degree. With decreasing effective irradiance, both the modelled and the measured ratio rise. There are differences between the models, where the PVsyst model shows the best fit, whereas the DeSoto and CEC models overestimate the ratio for high irradiance and underestimate it for lower irradiance.
All models, however, struggle to accurately depict the Imp/Isc ratio. While models see an increasing ratio with lower module temperature (which is co-linear with effective irradiance), the measured data does not follow such a trend. In the measured data, the Imp/Isc is almost independent of cell temperature and covers a span of around 15%, while the modelled ratio lies in a tight corridor of 2–3% for all models, hence it is estimated to be almost constant. This mismatch could be a potential starting point for improvement of the investigated models.
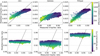 |
Fig. 11 Measured versus modelled Vmp/Voc (top) and Imp/Isc (bottom) ratios. The left column displays the CEC model, the middle column shows the DeSoto model and the right column is showing the PVsyst model. Color bars show dependence on effective irradiance and cell temperature. Data shown are for module A2. |
4 Conclusions
This work presented a comparison of current equivalent circuit models estimating the IV characteristics of bifacial PV modules. Using outdoor IV measurements on a high accuracy measurement setup, this validation was performed on eight current-generation bifacial PERC modules aged one to three years. The analysis included the range of irradiance and temperature conditions available over a full year in Denmark.
The results showed that when models are parameterized with datasheet specifications, modellers should expect significant errors at Pmp, which is the most common parameter of interest in the PV industry. There is no clear favorite between the models as they have different strengths. The DeSoto performed the best on Pmp, but worse on Voc and Isc. The CEC and PVsyst models performed similar to each other. For most IV parameters, the models displayed a positive estimation bias, which was also influenced by the fact that datasheet parameters used for model calibration were overestimated. In this analysis, loss factors for soiling, degradation, or cable losses were considered negligible and not applied.
Errors are smaller at Voc, compared to Isc and Pmp, meaning that modelers can rely on Voc estimates more than for the other parameters. Similarly, the Vmp/Voc ratio is characterized more accurately than the Imp/Isc ratio, the latter of which could be investigated for future improvements to the models.
All models show weaknesses in the irradiance and temperature dependence at Isc. For Pmp and Voc, the modelling errors show different temperature and irradiance dependencies for the different models. The CEC and PVsyst model have an improved temperature and irradiance dependency of Voc compared to the DeSoto model, but the DeSoto performed better at estimating Pmp.
We observed significant differences in modelling accuracy between modules of different types and found that differences between modules of the same type depend on the module type under investigation − a limitation originating from the use of generic datasheet parameters for model parametrization.
A monofacial module showed on par or worse modelling results compared to the bifacial modules, indicating that the modelling assumption of a combined effective irradiance for the single diode model is solid and it is not leading to increased modelling errors.
The analysis can serve as a benchmark for modelling using datasheet values, as module – or system-specific data is not usually available. This work was performed on the module level and should be extended to include the module mismatch in PV strings.
Funding
This research has been carried out within the EUDP research project “DigitalPV − Digitalisation of PV operations”, case no. 64021-2082 and was partially funded by the Technical University of Denmark.
Conflicts of interest
The authors declare no known conflict of interests related to this publication.
Data availability statement
The data set from this publication is publicly available at https://data.dtu.dk/articles/dataset/Module_level_IV_curve_data_set/27901599 and includes measured IV curves, module temperature and front and rear side plane of array irradiance.
Author contribution statement
Conceptualization M.B., L.M. and S.S.; Methodology M.B., L.M. and S.S.; Validation M.B., L.M.; Formal Analysis M.B.; Investigation M.B.; Data Curation M.B.; Writing – Original Draft Preparation M.B.; Writing – Review & Editing M.B., L.M. and S.S.; Visualization M.B., L.M.; Supervision S.S. and P.P.; Project Administration P.P; Funding Acquisition P.P.
References
- M. Köntges et al., Performance and reliability of photovoltaic systems: subtask 3.2: review of failures of photovoltaic modules, in Sankt Ursen: International Energy Agency, Photovoltaic Power Systems Programme (2014) [Google Scholar]
- S. Spataru et al., Monitoring and fault detection in photovoltaic systems based on inverter measured string IV curves, in 31st European Photovoltaic Solar Energy Conference and Exhibition (2015). https://doi.org/10.4229/EUPVSEC20152015-5BO.12.2 [Google Scholar]
- M.H. Ali et al., Real time fault detection in photovoltaic systems, Energy Proc. 111, 914 (2017) [CrossRef] [Google Scholar]
- G. Raina, S. Sinha, A holistic review approach of design considerations, modelling, challenges and future applications for bifacial photovoltaics, Energy Convers. Manag. 271, 116290 (2022) [CrossRef] [Google Scholar]
- W. Gu et al., A comprehensive review and outlook of bifacial photovoltaic (bPV) technology, Energy Convers. Manag. 223, 113283 (2020) [CrossRef] [Google Scholar]
- N. Riedel-Lyngskær et al., Measuring irradiance with bifacial reference panels, IEEE J. Photovolt. 12, 1324 (2022) [CrossRef] [Google Scholar]
- A. Garrod, A. Ghosh, A review of bifacial solar photovoltaic applications, Front. Energy 17, 704 (2023) [Google Scholar]
- N. DiOrio, C. Deline, Bifacial Simulation in SAM, in PV 2018 Workshop, 10-11 September 2018 (2018). https://www.nrel.gov/docs/fy18osti/72360.pdf [Google Scholar]
- PVsyst SA, Bi-facial modules (1994−2022). https://www.pvsyst.com/help-pvsyst7/index.html?bifacial_module.htm [Google Scholar]
- pvlib python Development Team, Bifacial modeling. en. 2013−2021. https://pvlib-python.readthedocs.io/en/stable/user_guide/bifacial.html [Google Scholar]
- PVsyst SA, Standard one-diode-model. en. 1994−2022. https://www.pvsyst.com/help/index.html?pvmodule_model.htm [Google Scholar]
- A.P. Dobos, An improved coefficient calculator for the california energy commission 6 parameter photovoltaic module model, J. Solar Energy Eng. 134, 021011 (2012) [CrossRef] [Google Scholar]
- W. De Soto, S.A. Klein, W.A. Beckman, Improvement and validation of a model for photovoltaic array performance, Solar Energy 80, 78 (2006) [CrossRef] [Google Scholar]
- K.S. Anderson et al., pvlib python: 2023 project update, J. Open Source Softw. 8, 5994 (2023) [CrossRef] [Google Scholar]
- D.L. King, J.A. Kratochvil, W.E. Boyson, Photovoltaic array performance model (Department of Energy, United States, 2004), Vol. 8 [Google Scholar]
- J.P. Singh, A.G. Aberle, T.M. Walsh, Electrical characterization method for bifacial photovoltaic modules, Sol. Energy Mater. Sol. Cells 127, 136 (2014) [CrossRef] [Google Scholar]
- G.J.M. Janssen et al., Outdoor performance of bifacial modules by measurements and modelling, Energy Proc. 77, 364 (2015) [CrossRef] [Google Scholar]
- S. Bouchakour et al., Modelling and simulation of bifacial PV production using monofacial electrical models, Energies 14, 4224 (2021) [CrossRef] [Google Scholar]
- L. Deville et al., Open-source photovoltaic model pipeline validation against well-characterized system data, Prog. Photovolt.: Res. Appl. 32, 291 (2024) [CrossRef] [Google Scholar]
- PV-Blocks (2024). URL: https://www.eko-instruments.com/us/categories/products/iv-measurement-instruments/pv-blocks [Google Scholar]
- C.W. Hansen, Estimation of parameters for single diode models using measured IV curves, in 2013 IEEE 39th Photovoltaic Specialists Conference (PVSC) (IEEE, Tampa, FL, 2013), p. 0223 [Google Scholar]
- N. Martin, J.M. Ruiz, Calculation of the PV modules angular losses under field conditions by means of an analytical model, Sol. Energy Mater. Sol. Cells 70, 25 (2001) [CrossRef] [Google Scholar]
- R. Perez et al., Modeling daylight availability and irradiance components from direct and global irradiance, Solar Energy 44, 271 (1990) [CrossRef] [Google Scholar]
- F. Kasten, A.T. Young, Revised optical air mass tables and a tables and approximation formula, Appl. Opt. 28, 4735 (1989) [CrossRef] [Google Scholar]
- J.S. Stein, C.W. Hansen, M.J. Reno, Global horizontal irradiance clear sky models: implementation and analysis (2012) [Google Scholar]
- G. Razongles et al., Bifacial photovoltaic modules: measurement challenges, Energy Proc. 92, 188 (2016) [CrossRef] [Google Scholar]
Cite this article as: Martin Bartholomäus, Luca Morino, Peter B. Poulsen, Sergiu V. Spataru, Benchmarking equivalent circuit models for the IV characteristic of bifacial photovoltaic modules, EPJ Photovoltaics 16, 12 (2025)
All Tables
PV module datasheet specifications of the three module types used. Repeated module types are deployed side by side and are measured and modelled separately. Module A1 is made monofacial by applying a rubber cover on the back side.
Modelling error of each model at Pmp, Isc and Voc as an average of all bifacial modules. All values are given in %.
All Figures
|
Fig. 1 Outdoor PV module IV measurement system deployed Risø, DTU. |
| In the text | |
|
Fig. 2 Example of measured module temperatures, GPOA and RPOA irradiance acquired by the system in Figure 1, for a clear sky day (July 8th, 2023). |
| In the text | |
|
Fig. 3 IV characteristics modelling flowchart. The irradiance modelling chain is marked in blue, temperature modelling in purple and the electrical modelling chain in red. |
| In the text | |
|
Fig. 4 Deviation of datasheet specifications versus flash test measurements of the eight modules included in this study. Shown are 5 relevant points on the IV curve and the bifaciality factor. Flash tests were done with an Endeas Quicksun at STC before module deployment. |
| In the text | |
|
Fig. 5 Modelling error for Pmp. a) nRMSE versus nMBE from modelled IV characteristic. Individual modules are marked with unique symbols and the models have dedicated colors. b) Relative differences between modelled and measured Isc, Pmp and Voc values separated by modules. Colors represent models. |
| In the text | |
|
Fig. 6 Influence of effective irradiance (a) and cell temperature (b) on the nMBE of Pmp for each of the models as an average of all modules. |
| In the text | |
|
Fig. 7 Modelling error for Isc. a) nRMSE versus nMBE from modelled IV characteristic. Individual modules are marked with unique symbols and the models have dedicated colors. b) Relative differences (=nMBE) between modelled and measured Isc, Pmp and Voc values separated by modules. Colors represent models. |
| In the text | |
|
Fig. 8 Influence of effective irradiance (a) and cell temperature (b) on the nMBE of Isc for each of the models. |
| In the text | |
|
Fig. 9 Modelling error for Voc. a) nRMSE versus nMBE from modelled IV characteristic. Individual modules are marked with unique symbols and the models have dedicated colors. b) Relative differences between modelled and measured Isc, Pmp and Voc values separated by modules. Colors represent models. |
| In the text | |
|
Fig. 10 Influence of effective irradiance (a) and cell temperature (b) on the nMBE of Voc for each of the models. |
| In the text | |
|
Fig. 11 Measured versus modelled Vmp/Voc (top) and Imp/Isc (bottom) ratios. The left column displays the CEC model, the middle column shows the DeSoto model and the right column is showing the PVsyst model. Color bars show dependence on effective irradiance and cell temperature. Data shown are for module A2. |
| In the text | |
Current usage metrics show cumulative count of Article Views (full-text article views including HTML views, PDF and ePub downloads, according to the available data) and Abstracts Views on Vision4Press platform.
Data correspond to usage on the plateform after 2015. The current usage metrics is available 48-96 hours after online publication and is updated daily on week days.
Initial download of the metrics may take a while.