Fig. 2
Download original image
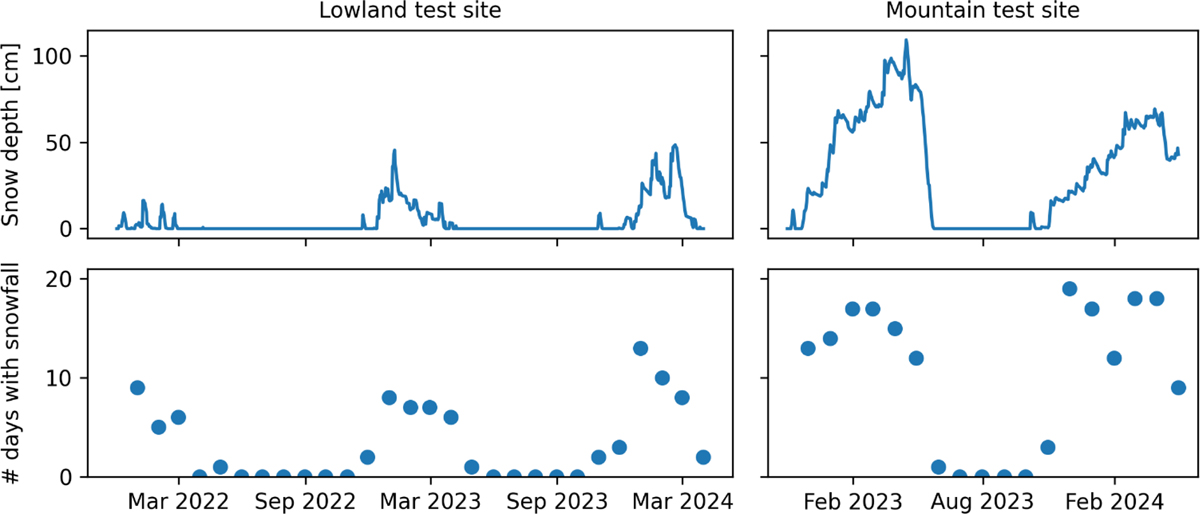
Snow data for the two test sites from SeNorge.no. The upper figures show the daily snow depth for the analyzed periods, and the lower figures show the number of days per month with snowfall.
Current usage metrics show cumulative count of Article Views (full-text article views including HTML views, PDF and ePub downloads, according to the available data) and Abstracts Views on Vision4Press platform.
Data correspond to usage on the plateform after 2015. The current usage metrics is available 48-96 hours after online publication and is updated daily on week days.
Initial download of the metrics may take a while.