Fig. 8
Download original image
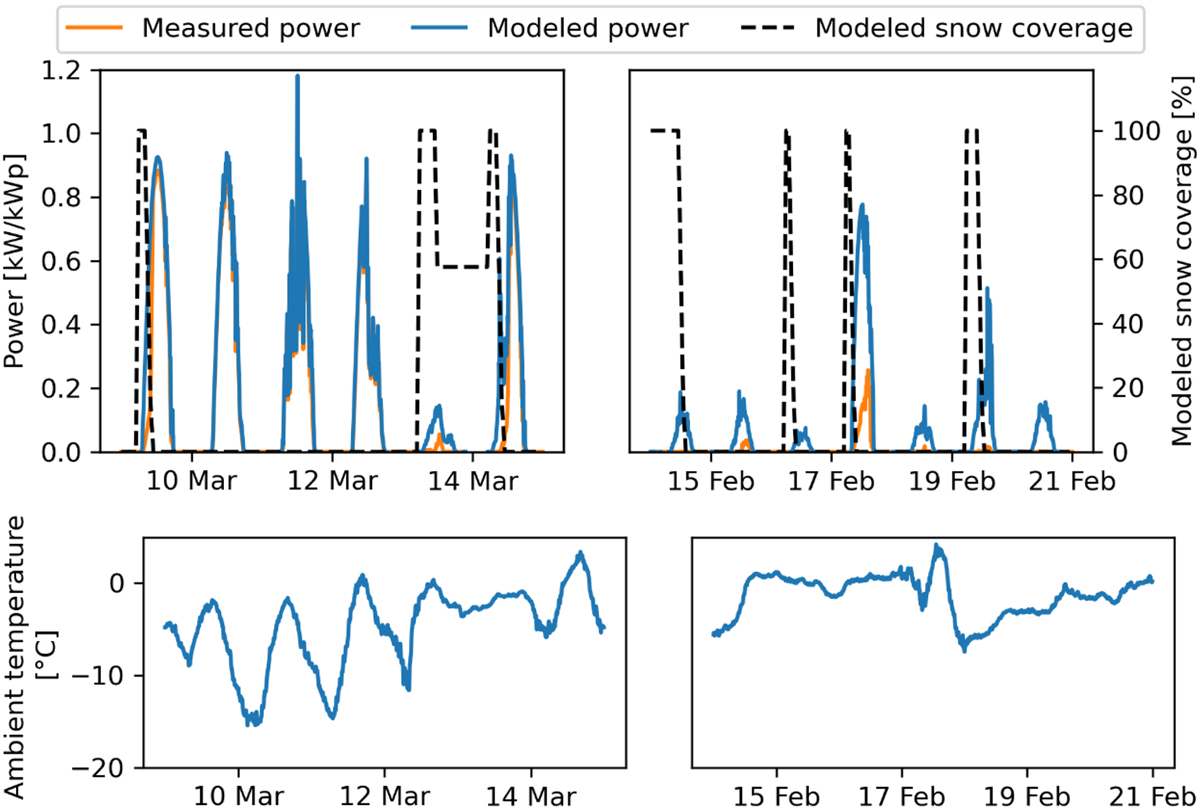
Measured and modeled power together with modeled snow coverage for one of the monofacial arrays at the lowland test site (A) during a cold period with high irradiance (left) and during a warmer period with low irradiance (right). The modeled power shows the expected power without snow, and the difference between measured and modeled power is the snow loss.
Current usage metrics show cumulative count of Article Views (full-text article views including HTML views, PDF and ePub downloads, according to the available data) and Abstracts Views on Vision4Press platform.
Data correspond to usage on the plateform after 2015. The current usage metrics is available 48-96 hours after online publication and is updated daily on week days.
Initial download of the metrics may take a while.