| Issue |
EPJ Photovolt.
Volume 17, 2026
Special Issue on ‘EU PVSEC 2025: State of the Art and Developments in Photovoltaics', edited by Robert Kenny and Carlos del Cañizo
|
|
|---|---|---|
| Article Number | 7 | |
| Number of page(s) | 9 | |
| DOI | https://doi.org/10.1051/epjpv/2025029 | |
| Published online | 06 February 2026 | |
https://doi.org/10.1051/epjpv/2025029
Original Article
Strategy for simple, on-site failure analysis: investigating bubbles and burn marks in backsheets of PV modules
1
Forschungszentrum Jülich GmbH, Helmholtz-Institute Erlangen-Nürnberg, HI ERN, 91058 Erlangen, Germany
2
Energy Research Laboratory Fotovoltaica/UFSC, Florianópolis, Brazil
* e-mail: This email address is being protected from spambots. You need JavaScript enabled to view it.
Received:
31
July
2025
Accepted:
11
December
2025
Published online: 6 February 2026
Abstract
We present a practical, field-deployable workflow for the identification and analysis of localized polymer degradation in photovoltaic modules, observed as bubbles and burn marks in three multi-MWp power plants in Brazil and Germany. The approach combines high-throughput screening—visual inspection, infrared thermography, ultraviolet fluorescence imaging, and serial-number mapping—with selective in-depth analyses of representative modules using electroluminescence, current–voltage measurements, and near-infrared absorption spectroscopy. The workflow enables efficient detection of anomalies across large installations, while confirmatory tests validate root causes on a limited subset. Defects occurred in about 3–4% of inspected modules and were concentrated in the upper and lower cell rows. Although all sites experienced similar partial shading, anomalies appeared only in PET-based backsheets with PVDF or PVF outer layers, highlighting material-dependent susceptibility. No immediate electrical or safety impact was found, but continued monitoring is advised to mitigate future reliability risks. The presented methodology offers a scalable, drone-compatible framework for early-stage field detection of polymer degradation.
Key words: Field measurements / defect detection / backsheet degradation / inter-row spacing / PV operation & maintenance
These authors contributed equally to this work.
© B. Käßer et al., Published by EDP Sciences, 2026
 This is an Open Access article distributed under the terms of the Creative Commons Attribution License (https://creativecommons.org/licenses/by/4.0), which permits unrestricted use, distribution, and reproduction in any medium, provided the original work is properly cited.
1 Introduction
Several multi-megawatt (MWp) photovoltaic (PV) power plants have reported operational anomalies that conventional electrical measurements failed to detect. Given the plants’ short operational time, early identification of root causes is essential to prevent further degradation and to ensure long-term system reliability. To address these challenges, we implemented a multi-method, large-scale inspection across three multi-MWp power stations, aiming to evaluate and understand the root-cause for the formation of these anomalies. In this publication the terms anomalies and faults refer to bubbles on the module backside or delamination on the module frontside that are sometimes accompanied with burn marks. Our diagnostic strategy combined visual inspection (VIS), ultraviolet fluorescence (UVF) imaging, infrared (IR) imaging, serial number (SN) scanning, electroluminescence (EL) imaging, current-voltage (IV) measurements, and near-infrared absorption spectroscopy (NIRA). Our hypothesis is that inter-row shading can cause damage to vulnerable areas of PV modules and impact system reliability and longevity. Although various PV plant modeling approaches have been developed to optimize short-term performance [1–3], integrating these with degradation assessments is essential to improve system durability and extend operational lifetime.
This work introduces a two-stage diagnostic workflow rather than a purely investigative case study. In the first stage, rapid screening methods (VIS, UVF, IR, SN mapping) are applied to large module populations to identify anomalies efficiently [4]. In the second stage, targeted confirmatory methods (EL, IV, NIRA) are performed only on selected modules to determine root causes. Although EL and IV are not high-throughput, applying them selectively keeps the overall workflow time- and cost-efficient for multi-MWp systems. VIS serves as the initial diagnostic tool, enabling documentation of surface-level faults and anomalies. This is complemented by SN scanning, which facilitates the correlation of data across diagnostic techniques and supports statistical analysis. IR imaging enables the identification of hotspots and other thermal irregularities. UVF imaging detects polymer degradation and composition differences, as specific degradation byproducts fluoresce under UV light in characteristic patterns depending on their material composition [4–8]. In addition to these methods, more targeted techniques are employed, albeit with greater time and equipment demands. EL imaging consists of the application of direct current to induce photon emission, allowing the identification of inactive or electrically disconnected regions, which appear as dark areas in the resulting images. IV-measurements provide the most direct assessment of electrical performance parameters, including fill factor and peak power output [9,10].
Among PV module components, polymer materials—used in encapsulants and backsheets—are typically the first to exhibit signs of aging. In all plants included in this study, the modules featured polymer-based backsheets and ethylene-vinyl acetate (EVA) encapsulants, which are known to exhibit early-stage degradation under combined thermal and UV stress. Delamination caused by thermo-mechanical stresses can occur at the interfaces between the encapsulant and adjacent layers, such as the glass, cell, or backsheet. In addition, photo- and electrochemical degradation processes can further promote cell–encapsulant delamination through the ingress of moisture and air. Furthermore, the photodegradation of EVA generates acetic acid, which in turn accelerates corrosion and contributes to further material degradation like browning and hotspots [11–17]. NIRA spectroscopy has emerged as a valuable tool for material identification, degradation analysis, and moisture monitoring in encapsulants and backsheets [18–20].
Our study focuses on a specific, yet frequently overlooked, degradation pattern: the formation of faults in PV module backsheets, which we hypothesize to be induced by localized thermal stress from cyclic partial shading. The approach acknowledges that observed anomalies may function both as root causes of system degradation and as indicators of existing malfunctions or suboptimal component interactions. As a case study, we examine modules exhibiting anomalies on both the front and rear sides, as initially reported by plant operators, with the underlying cause remaining unidentified (Fig. 1).
 |
Fig. 1 Potential/observed consequences of (cyclic) shading: bubbles, blisters and burn marks. |
2 Methodology
Three relatively new PV power plants with anomalies reported on modules were studied by methods detailed in Table 1. Two multi-MWp power plants are located at the northeast region of Brazil and operate modules (nominal power: 325 Wp, area: 1.94 m²) mounted on single-axis tracking systems for four and three years, respectively. The pitch between rows is 4.49 m and the modules are installed in portrait mode. For the Brazilian sites, shading percentages were calculated using the Python-based library pvlib [21–24] to analyze shading and plane of array (POA) irradiance throughout the day and year. The third multi-MWp PV system analyzed has been operated for 2 years in central Germany with modules (nominal power: 445 Wp, area: 2.17 m²) installed on a fixed tilted structure.
Visual inspections were carried out manually and on foot, following the standardized nomenclature and procedures described by NREL [25]. IR imaging was likewise performed manually at the Brazilian sites using a handheld FLIR T540 24°, whereas at the German site it was drone-mounted to efficiently cover a larger module population. UVF imaging was conducted manually during nighttime to detect signs of polymer degradation. For each inspection method, module serial numbers were recorded to compile a comprehensive, traceable database. This approach enabled correlation between the detected thermal anomalies (hot spots) and the visual/fluorescence features observed on the same modules.
More targeted methods, requiring additional effort, were carried out to a subset of modules. IV measurements were obtained in the field using a PVPM 1500X tracer (PVE Photovoltaik Engineering, Germany) with the four-wire method, eliminating voltage-drop errors from cable resistance. During each measurement, module temperature and front/rear irradiance were recorded simultaneously using a monocrystalline reference cell positioned in the module plane, and all data were normalized to STC (1000 W m⁻², 25 °C, AM 1.5 G). A total of 15 modules at the Brazil 1 site (10 affected, 5 reference) were tested.
NIRA was applied in-situ to identify polymers in the encapsulant and backsheet and to evaluate water index (WI) and carbonyl index (CI). Measurements were performed with NIRONE S2.0 (1550–1950 nm) and NIRONE S2.2 (1750–2150 nm) spectrometers (Spectral Engines, Finland)—portable MEMS Fabry–Perot interferometer sensors coupled to a single InGaAs photodetector, each offering a programmable optical filter with 10 nm acquisition step. The sensor, enclosed in a custom polyurethane protective housing, was placed in contact on the backsheet under a silicon cell and manually held during acquisition. The housing shields an area of ∼1 cm² from ambient solar light. At session start, dark and illuminated Spectralon references were recorded. The typical integration time was 50 ms, averaging 10–20 scans. Spectra were processed within the device/app workflow, and an offline machine learning classifier (trained on our reference spectra) delivered on-site backsheet labels. For index evaluation, spectra were recorded from the front glass at a busbar position. WI (1850–1940 nm) was computed from S2.0/S2.2 data acquired at the same busbar spot. CI (∼2130 nm)—which lies within the S2.2 range—was obtained with S2.2 where available [26]. Interpretation of the indices is subject to certain limitations: WI is sensitive to measurement timing and local temperature and humidity, and thus represents an instantaneous state during the field campaign. CI depends not only on photo-oxidation but also on the vinyl acetate content and additives of the EVA encapsulant. Because EVA grades may differ between module types and sites, CI and WI were used here only as qualitative, contextual indicators and not for quantitative degradation ranking across materials.
EL imaging was additionally employed to detect and characterize cell-level defects. The measurements were conducted during the night using a tripod-mounted Canon EOS M3 with PV vision EL Lens 1.4/50. An adjustable power source (IT6722A) was used to reversible polarize the modules with an excitation current of 10% of the short-circuit current of the PV module.
3 Results
This section presents the results of the field inspections performed at the three PV plants, focusing on the occurrence, distribution, and characteristics of faults, and related degradation patterns. VIS revealed that 3.4% (Brazil 1), 3.08% (Brazil 2), and 4.3% (Germany) of the inspected modules show anomalies on the backsheet. Exemplary appearances of these defects are illustrated in Figure 1. These defects were not randomly distributed but rather concentrated along the bottom cell rows, and in the case of tracking systems, also along the top rows, at the module’s short edges. Within these areas, faults consistently appeared at critical points such as cell edges, corners, contact points or between the contact points. Although the anomalies are not readily visible from the front side, their identification becomes possible when guided by prior rear-side inspection, discerning front-side features indicative of delamination, corrosion, and scorch marks.
To better understand whether defects were associated with specific production batches, SN scanning was performed. In addition, it facilitated the relation of the findings from different inspection techniques and helped to identify potentially more critical positions and locations within the PV plant. At Brazil 1, the modules were categorized into eight distinct groups (A-H) according to recurring patterns in the multi-digit SN. Interestingly, modules with faults were exclusively found in SN group D, which modules were distributed across the entire plant. 9.8% of the modules exhibited these anomalies within group D, which accounts for approx. 34% of the modules inspected. Figure 2 shows the distribution of the SN groups and the positions of the anomalies on a map. So far, no particular physical locations, e.g., row ends, have been identified as more sensitive to form burn marks. In Germany, however, the positions of faulty modules often correlated with the most exposed positions in the hilly topography of the PV plant.
Material characterization through NIRA spectroscopy confirmed the use of EVA encapsulant and usually a double-fluoropolymer as the backsheet. The backsheets comprise of different combinations of polyethylene terephthalate (PET), polyvinylidene fluoride (PVDF), polyvinyl fluoride (PVF), fluorinated coating (FC), and polyethylene (PE) (Tab. 2). Across all sites, signs of material degradation were observed exclusively in PVDF- and PVF-based backsheets; no faults were recorded for PET or FC backsheets within our inspected sample.
The WI quantifies moisture uptake in encapsulant and backsheet materials. The CI reflects the formation of oxidation products such as ketones and carboxylic acids in EVA due to photooxidative degradation. Elevated WI and CI values have been correlated with electrical failure modes, including increased leakage current, reduced insulation resistance, and the occurrence of potential-induced degradation (PID) [27–29]. Average CI and WI indices varied across the three test sites (Tab. 2), reflecting differences in environmental exposure and operational age.
Across the three sites, CI values were broadly similar, consistent with early-stage ageing. WI differed by site, reflecting environmental exposure, but—as WI is time-dependent—we interpret it qualitatively as a snapshot during the campaign rather than a lifetime metric. We therefore do not attempt to rank materials by CI or WI in this dataset; instead, CI and WI are used to contextualize climate and exposure while detailed fault localization relies on VIS, UVF, IR, and EL and backsheet identification by NIRA.
When targeting modules with anomalies, UVF images showed ring-shaped fluorescence patterns, indicating similar encapsulant materials in Brazil. Deviations from this pattern (gaps, distortions etc.) were observed in some cells, which aligned with anomalies from VIS, likely due to an increased transmission of air and humidity through the degraded backsheet (Fig. 3a). Additionally, localized increases in UVF intensity were detected, potentially caused by elevated temperatures (Figs. 4a and 4b) [4–6]. In particular, a nearly twofold increase in UVF peak intensity was observed in the outer halves of top and bottom cells. This enhancement is clearly reflected in the plots of mean intensity along both the horizontal and vertical axes of the two outermost module rows and to a lesser extend also visible in the peak broadening (Fig. 4). While edge effects exhibited a similar trend, their magnitude was significantly lower and thus insufficient to account for the observed intensity increase. A paired sample t-test comparing the last and second-to-last intensity peaks of ten modules yielded a p-value of 1.4 × 10⁻⁶, confirming the statistical significance of the increased UVF intensity. In contrast, modules from other PV sites showed no such effect (p-value = 0.48). Furthermore, an around 30% increase in UVF intensity was consistently observed in the central region of the first cell row, aligning spatially with the junction box. IR images confirmed elevated temperatures at these junction box positions. This phenomenon strengthens our hypothesis of the presence of elevated temperatures at the edge cells correlating with increased UVF intensity. Due to a combination of lower UV exposure and the relatively short operation time, UVF imaging did not reveal strong fluorescence patterns in Germany. In Figure 3, the IR image (b1) shows an apparently larger affected area because the thermal anomaly extends beyond the visibly degraded region seen in VIS and UVF (b2–b3). This difference reflects the distinct sensitivities of the techniques: IR imaging captures heat diffusion, whereas VIS and UVF reveal only the localized polymer damage. Furthermore, IR imaging in Germany (Fig. 3b) identified 39 anomalies (overheated cells, hot spots etc.), with 30% exhibiting faults also showing corresponding IR anomalies, reinforcing the association between thermal stress and localized material failure further.
Additionally, EL images of the affected modules showed electrically inactive cell areas (Figs. 4b and 5 presenting three examples). The edges of the peripheral cells appear dark in EL images, indicating electrically deactivated regions. In contrast, the central cells remained unaffected, as confirmed by EL images of sample modules (one example in Fig. 3c). These defects are highly concentrated in specific areas and align with anomalies found in VIS and anomalies visible in UVF (Fig. 4).
IV measurements of defective modules in Brazil yielded an average peak power output of 267 ± 2.9 W, which was comparable to that of intact modules (267 ± 3.7 W). This indicates that, despite the physical degradation observed in the backsheets, no immediate impact on power output was detected. Insulation resistance measurements did not reveal any critical reductions, as other field studies reported [30,31], which may be attributed to the climatic conditions. The overall shading percentages and solar POA irradiance of the Brazilian sites were estimated based on pitch, maximum tracker angle, collector width and geographical location (Fig. 6) using a simple model provided by pvlib. The calculated ground cover ratio was 0.44, which is above the average for installations at the same latitude (∼0.38 [32] or ∼0.35 [33]). Shading affecting only half of the bottom or top cell row, corresponding to an approximate shading fraction of below 5%, was identified as a critical condition for inducing reverse bias, thereby causing localized heating within the module (bottom and top cells row as also confirmed by the increased UVF intensity at the edges). The duration of this partial shading remains relatively constant throughout the year, lasting between 10 and 12 min daily. The average and maximum irradiance varies with seasons, with average and maximum values ranging from 635 W/m² to 770 W/m². Quantitative shading analyses were limited to the two Brazilian sites, as the German plant’s uneven terrain led to variations in tilt angles, row spacing, and inter-row distances, making a single representative pitch or uniform shading simulation unreliable.
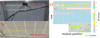 |
Fig. 2 Typical positions of faults, top cell row on junction box side (a) and bottom cell row opposite junction box side (b), mapping of batches and marking modules with anomalies at the Brazil 1 site (c). |
Quantity of PV modules investigated using different methods, visual inspection (VIS), serial number scanning (SN), Infrared imaging (IR), UV fluorescence imaging (UVF), near infrared absorption spectroscopy (NIRA), electroluminescence (EL), current-voltage measurements (IV).
Correlating backsheet materials (PVDF–PET–PVDF (PVDF), FC–PET–FC (FC), PVF-PET-PVF (PVF), and PET–PE–PET or PET–PET–PE (PET)), carbonyl index (CI), water index (WI), and operation time with failure percentages.
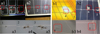 |
Fig. 3 Comparison of UVF and IR imaging for two modules. UVF image with 3 defects (a), IR image with two defects (b), with corresponding front and rear (images horizontally flipped) VIS. Numbers 1-5 identify the same areas. |
 |
Fig. 4 Two complementary techniques indicating elevated temperatures and faults in bottom cell rows for two different modules: UVF image of the two outer-most cell rows (negative for enhanced visibility) and corresponding mean intensity along horizontal and vertical axes of modules (a), EL-images showing inactive areas (b). |
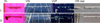 |
Fig. 5 Visualization of cell parts affected with anomalies (top and bottom row) for two exemplary PV modules I and II, from left to right: EL, VIS, UVF from the front and VIS from the rear (rear VIS images horizontally flipped). |
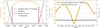 |
Fig. 6 Calculated irradiances and shaded fractions in Brazil; shading fractions below 5% highlighted on 2024.06.01 (left); maximum irradiance and shading time below 5% throughout 2024 (right). |
4 Discussion
Based on the data presented in Table 2, our analysis suggests that, in the power plants evaluated, the formation of faults was a highly localized phenomenon, restricted to the top and bottom cell rows. We hypothesize that these defects resulted from localized temperature increases induced by partial shading. Although no direct temperature measurements were recorded during the field campaign, our interpretation is based on the spatial correlation between the observed anomalies and the shaded cell regions identified in VIS, UVF, and IR images. This qualitative agreement supports the proposed mechanism even in the absence of direct thermal data. Specifically, adjacent rows created partial shading of these cells early in the morning or, in the case of tracking installations, in the morning and late in the afternoon as well. This hypothesis is supported by elevated UVF intensity at bottom/top cell rows and at junction boxes consistent with localized thermal differences. Also, shading and irradiance modeling confirm consistent shading of bottom/top cell rows with irradiance levels reaching up to 770 W/m². The partial shading induced reverse bias in the affected cells, concentrating current density particularly at the vulnerable areas of the module, particularly cell edges and soldering points potentially due to variations in material selection or manufacturing parameters. Literature reports that reverse-bias hot-spots in c-Si modules can exceed ∼100°C at the cell that were observed in controlled hot-spot endurance tests; front-surface IR typically underestimates cell peak temperature due to the glass cover and lateral heat spreading [34–36].
As only specific backsheet compositions exhibited defects, we assume that the thermal degradation of polymers—specifically EVA, PET, PVF and PVDF—is the primary contributing factor. The decomposition of these materials produce gaseous byproducts [11–14].
Multilayer backsheets provide limited but finite permeability to small molecules: diffusion through fluoropolymer/PET stacks is slow relative to short hot-spot events, enabling local gas build-up and blistering, whereas long-term diffusion/venting (or leakage via micro-cracks) can release gases over extended periods. This aligns with published permeability data and field observations of moisture ingress [37].
Site-level CI and WI were broadly similar in magnitude across plants (Tab. 2). We interpret these indices qualitatively: WI represents a time-dependent field snapshot, and CI can reflect EVA formulation (e.g., VA content, additives) in addition to photo-oxidation [28]. Accordingly, we do not assign degradation mechanisms based on CI and WI alone and rely instead on VIS, UVF, IR, and EL fault localization and backsheet identification for our conclusions.
Whereas EL images show electrically inactive cell edge regions in modules, IV measurements demonstrate no measurable performance loss of affected modules. Previous studies on backsheet degradation are consistent with these results but suggest a future decline in insulation resistance. Continued monitoring is necessary to track the progression of these issues. Degraded backsheets facilitate moisture ingress, increasing the risk of faults like corrosion, delamination, and reduced insulation resistance [31,38]. Further measurements, especially under different climatic conditions, are essential to assess how these issues may evolve and impact long-term module reliability.
Although shading patterns were uniform across all module groups, the occurrence of anomalies was restricted to serial-number Group D. This finding suggests that manufacturing or material-related differences—rather than shading alone—were the dominant factors in defect formation. All groups experienced similar daily partial shading of the top and bottom cell rows (covering <5% of module area, confirmed by pvlib simulations), yet only Group D exhibited visible backsheet degradation. The affected batch likely had minor variations in polymer formulation, lamination conditions, or cell–ribbon adhesion, which increased its sensitivity to localized reverse-bias heating and gas accumulation within the backsheet stack. This interpretation is consistent with (i) the identical environmental and operating conditions across groups, (ii) the consistent localization of defects at cell edges and solder points, and (iii) the observation that comparable shading conditions at other sites (Brazil 2 and Germany) led to degradation only in PVF and PVDF-based backsheets. These results reinforce that partial shading acts primarily as a trigger, while batch-dependent material properties control the actual manifestation and severity of degradation. This highlights the importance of stringent quality control in manufacturing and routine maintenance of PV power plants. To enable an effective and efficient approach for fault detection in operational PV plants we propose high-throughput, on-site inspection using VIS, UVF, IR, supported by EL imaging, IV measurements and NIRA analysis for selected modules. VIS allows for a rapid identification of faults, including those located on the front and rear sides of modules. As shown in Figure 3, IR imaging sometimes fails to detect smaller faults, that can be detected by UVF. The more in-depth methods EL, IV, and NIRA support the analysis by correlating the faults to potential causes and effects. This method facilitates proactive maintenance, allowing operators to identify weak points and mitigate potential risks before they impact system performance and cause safety issues.
5 Conclusion
This study demonstrates that early-stage polymer degradation can occur even in relatively new PV modules when localized thermal stress from partial shading coincides with material vulnerabilities. The results show that shading primarily acts as a trigger, whereas backsheet composition and manufacturing variations (notably PVDF/PVF constructions) determine the severity and distribution of the damage. No measurable performance or insulation losses were detected at the time of inspection, confirming that the affected modules remain operational and safe. However, the presence of visible backsheet anomalies justifies periodic monitoring to prevent long-term reliability issues.
The proposed methodology integrates high-throughput techniques (VIS, IR, UVF, SN) for rapid, scalable screening with targeted analyses (EL, IV, NIRA) for detailed fault confirmation. This combined approach enables early identification of material-specific weaknesses and supports predictive maintenance in large-scale PV plants.
Funding
We gratefully thank the Alexander von Humboldt Stiftung for funding the collaboration between UFSC and HI ERN. HI ERN thanks for the support of the ZIM Project RobInspec FKN: 16KN083044, dig4morE,” FKZ: 03EE1090B, “REMBup” FKZ: 03WR021F by the Federal Ministry for Economic Affairs and Climate Action on the basis of a decision by the German Bundestag, and the Helmholtz Association in the framework of the innovation platform “Solar TAP” (No. 714-62150-3/1 (2023)).
Conflicts of interest
The authors declare no conflict of interest.
Data availability statement
Data associated with this article cannot be disclosed due to confidential reason.
Author contribution statement
Writing – Original Draft Preparation: Bernhardt Käßer, Claudia Buerhop. Writing – Review & Editing: Bernhardt Käßer, Claudia Buerhop, Aline Kirsten Vidal de Oliveira, Oleksandr Mashkov, I. Marius Peters. Visualization: Bernhardt Käßer, Claudia Buerhop. Software: Bernhardt Käßer. Methology: Claudia Buerhop. Investigation: Bernhardt Käßer, Aline Kirsten Vidal de Oliveira, Oleksandr Mashkov, Lucas Nascimento, Claudia Buerhop. Conceptualization: Claudia Buerhop. Supervision: Ricardo Rüther, I. Marius Peters, Claudia Buerhop. Funding Acquisition: Ricardo Rüther, I. Marius Peters, Claudia Buerhop.
References
- C. Ma, Z. Deng, X. Xu, X. Pang, X. Li, R. Wu, Z. Tian, Space optimization of utility-scale photovoltaic power plants considering the impact of inter-row shading, Appl. Energy. 370, 123591 (2024). https://doi.org/10.1016/j.apenergy.2024.123591 [Google Scholar]
- Y.-M. Saint-Drenan, T. Barbier, Data-analysis and modelling of the effect of inter-row shading on the power production of photovoltaic plants, Sol. Energy 184, 127 (2019). https://doi.org/10.1016/j.solener.2019.03.086 [Google Scholar]
- A. Barbón, V. Carreira-Fontao, L. Bayón, C.A. Silva, Optimal design and cost analysis of single-axis tracking photovoltaic power plants, Renew. Energy. 211, 626 (2023). https://doi.org/10.1016/j.renene.2023.04.110 [Google Scholar]
- C. Buerhop‐Lutz, O. Stroyuk, O. Mashkov, J.A. Hauch, I.M. Peters, Unveiling the potential of ultraviolet fluorescence imaging as a versatile inspection tool: insights from extensive photovoltaic module inspections in multi‐MWp photovoltaic power stations, Sol. RRL 8, (2024). https://doi.org/10.1002/solr.202400566 [Google Scholar]
- D.J. Colvin, A.M. Gabor, W.C. Oltjen, P.J. Knodle, A.D. Yao, B.A. Thompson, N. Khan, S. Lotfian, J. Raby, A. Jojo, X. Yu, M. Liggett, H.P. Seigneur, R.H. French, L.S. Bruckman, M. Li, K.O. Davis, Ultraviolet fluorescence imaging for photovoltaic module metrology: best practices and survey of features observed in fielded modules, IEEE J. Photovolt 15, 465 (2025). https://doi.org/10.1109/jphotov.2025.3545825 [Google Scholar]
- A. Morlier, M. Siebert, I. Kunze, G. Mathiak, M. Kontges, Detecting photovoltaic module failures in the field during daytime with ultraviolet fluorescence module inspection, IEEE J. Photovolt 7, 1710 (2017). https://doi.org/10.1109/jphotov.2017.2756452 [Google Scholar]
- U. Desai, B.K. Sharma, A. Singh, Assessment of the effect of accelerated ultraviolet aging on mini‐PV modules encapsulated with different poly(ethylene‐co‐vinyl acetate) formulations, J. Appl. Polym. Sci 140, (2023). https://doi.org/10.1002/app.54676 [Google Scholar]
- C. Peike, T. Kaltenbach, K.-A. Weiß, M. Koehl, Non-destructive degradation analysis of encapsulants in PV modules by Raman Spectroscopy, Sol. Energy Mater. Sol. Cells 95, 1686 (2011). https://doi.org/10.1016/j.solmat.2011.01.030 [Google Scholar]
- L. Koester, S. Lindig, A. Louwen, A. Astigarraga, G. Manzolini, D. Moser, Review of photovoltaic module degradation, field inspection techniques and techno-economic assessment, Renew. Sustain. Energy Rev 165, 112616 (2022). https://doi.org/10.1016/j.rser.2022.112616 [Google Scholar]
- M.M. Rahman, I. Khan, K. Alameh, Potential measurement techniques for photovoltaic module failure diagnosis: a review, Renew. Sustain. Energy Rev 151, 111532 (2021). https://doi.org/10.1016/j.rser.2021.111532 [Google Scholar]
- M.C.C. de Oliveira, A.S.A. Diniz Cardoso, M.M. Viana, V. de F.C. Lins, The causes and effects of degradation of encapsulant ethylene vinyl acetate copolymer (EVA) in crystalline silicon photovoltaic modules: a review, Renew. Sustain. Energy Rev 81, 2299 (2018). https://doi.org/10.1016/j.rser.2017.06.039 [Google Scholar]
- S. Jiang, K. Wang, H. Zhang, Y. Ding, Q. Yu, Encapsulation of PV modules using ethylene vinyl acetate copolymer as the encapsulant, Macromol. React. Eng 9, 522 (2015). https://doi.org/10.1002/mren.201400065 [Google Scholar]
- S. Ebnesajjad, Vinyl fluoride polymers (PVF), Encycl. Polym. Sci. Technol (2011). https://doi.org/10.1002/0471440264.pst388.pub2 [Google Scholar]
- S. Uličná, M. Owen-Bellini, S.L. Moffitt, A. Sinha, J. Tracy, K. Royo-Choudhury, D.C. Miller, P. Hacke, L.T. Schelhas, A study of degradation mechanisms in PVDF-based photovoltaic backsheets, Sci. Rep 12, 14399 (2022). https://doi.org/10.1038/s41598-022-18477-1 [Google Scholar]
- N. Bosco, J. Tracy, R. Dauskardt, Environmental influence on module delamination rate, IEEE J. Photovolt 9, 469 (2019). https://doi.org/10.1109/jphotov.2018.2877436 [Google Scholar]
- H. Al Mahdi, P.G. Leahy, M. Alghoul, A.P. Morrison, A review of photovoltaic module failure and degradation mechanisms: causes and detection techniques, Solar 4, 43 (2024). https://doi.org/10.3390/solar4010003 [CrossRef] [Google Scholar]
- R. Meena, A. Pareek, R. Gupta, A comprehensive review on interfacial delamination in photovoltaic modules, Renew. Sustain. Energy Rev 189, 113944 (2024). https://doi.org/10.1016/j.rser.2023.113944 [Google Scholar]
- E.W. Ciurczak, B. Igne, J. Workman Jr, D.A. Burns, Handbook of near-infrared analysis (CRC press, 2021) [Google Scholar]
- C. Pasquini, Near infrared spectroscopy: a mature analytical technique with new perspectives – a review, Anal. Chim. Acta 1026, 8 (2018). https://doi.org/10.1016/j.aca.2018.04.004 [CrossRef] [Google Scholar]
- Y. Ozaki, C. Huck, S. Tsuchikawa, S.B. Engelsen, Near-infrared spectroscopy: theory, spectral analysis, instrumentation, and applications (Springer Nature, 2020) [Google Scholar]
- K.S. Anderson, C.W. Hansen, W.F. Holmgren, A.R. Jensen, M.A. Mikofski, A. Driesse, pvlib python: 2023 project update, J. Open Source Softw 8, 5994 (2023). https://doi.org/10.21105/joss.05994 [Google Scholar]
- A.R. Jensen, K.S. Anderson, W.F. Holmgren, M.A. Mikofski, C.W. Hansen, L.J. Boeman, R. Loonen, pvlib iotools—Open-source Python functions for seamless access to solar irradiance data, Sol. Energy 266, 112092 (2023). https://doi.org/10.1016/j.solener.2023.112092 [Google Scholar]
- W.F. Holmgren, C.W. Hansen, M.A. Mikofski, pvlib python: a python package for modeling solar energy systems, J. Open Source Softw 3, 884 (2018). https://doi.org/10.21105/joss.00884 [Google Scholar]
- W. Holmgren et al., pvlib/pvlib-python: v0.13.0 (2025). https://doi.org/10.5281/ZENODO.15614720 [Google Scholar]
- C. Packard, J. Wohlgemuth, S. Kurtz, Development of a visual inspection data collection tool for evaluation of fielded PV module condition, in Office of Scientific and Technical Information (OSTI) (2012). https://doi.org/10.2172/1050110 [Google Scholar]
- O. Mashkov, L. Leihkamm, O. Stroyuk, C. Buerhop, T. Winkler, O. Ghaffari, S. Vorstoffel, E. Wittmann, J. Hauch, I.M. Peters, High‐throughput PV module diagnostics using a compact NIR spectrometer, Sol. RRL 9, 202500323 (2025). https://doi.org/10.1002/solr.202500323 [Google Scholar]
- O. Stroyuk, C. Buerhop‐Lutz, A. Vetter, J. Hepp, J. Hauch, I.M. Peters, C.J. Brabec, Distinguishing between different types of multi‐layered PET‐based backsheets of PV modules with near‐infrared spectroscopy, Prog. Photovolt. Res. Appl 30, 859 (2021). https://doi.org/10.1002/pip.3465 [Google Scholar]
- O. Stroyuk, C. Buerhop, E. Wittman, O. Mashkov, P. Stephan, J. Crozier McCleland, M. Vumbugwa, F. Vorster, E. van Dyk, J. Hauch, C. Brabec, M. Peters, Assessing field degradation of photovoltaic modules by near‐infrared absorption spectroscopy of ethylene vinyl acetate encapsulant, Sol. RRL 8, 2301022 (2024). https://doi.org/10.1002/solr.202301022 [Google Scholar]
- C. Buerhop, O. Stroyuk, O. Mashkov, A. Barabash, J.A. Hauch, I.M. Peters, Polymer encapsulation impact on potential-induced degradation in PV modules revealed by a multi-modal field study, Sol. Energy Mater. Sol. Cells 277, 113111 (2024). https://doi.org/10.1016/j.solmat.2024.113111 [Google Scholar]
- C. Buerhop, O. Stroyuk, J. Zöcklein, T. Pickel, J. Hauch, I.M. Peters, Wet leakage resistance development of modules with various backsheet types, Prog. Photovolt. Res. Appl 30, 938 (2021). https://doi.org/10.1002/pip.3481 [Google Scholar]
- O.K. Segbefia, A.G. Imenes, T.O. Sætre, Moisture ingress in photovoltaic modules: a review, Sol. Energy 224, 889 (2021). https://doi.org/10.1016/j.solener.2021.06.055 [Google Scholar]
- E.M. Tonita, A.C.J. Russell, C.E. Valdivia, K. Hinzer, Optimal ground coverage ratios for tracked, fixed-tilt, and vertical photovoltaic systems for latitudes up to 75°N, Sol. Energy 258, 8 (2023). https://doi.org/10.1016/j.solener.2023.04.038 [Google Scholar]
- P.H.A. Veríssimo, R.A. Campos, M.V. Guarnieri, J.P.A. Veríssimo, L.R. do Nascimento, R. Rüther, Area and LCOE considerations in utility-scale, single-axis tracking PV power plant topology optimization, Sol. Energy 211, 433 (2020). https://doi.org/10.1016/j.solener.2020.09.070 [Google Scholar]
- M. Khodapanah, T. Ghanbari, E. Moshksar, Z. Hosseini, Partial shading detection and hotspot prediction in photovoltaic systems based on numerical differentiation and integration of the P − V curves, IET Renew. Power Gener 17, 279 (2022). https://doi.org/10.1049/rpg2.12596 [Google Scholar]
- M. Afridi, A. Kumar, F. ibne Mahmood, G. TamizhMani, Comparative analysis of hotspot stress endurance in pristine and thermal cycled prestressed glass–glass photovoltaic modules, Sustainability 15, 12131 (2023). https://doi.org/10.3390/su151612131 [Google Scholar]
- M. Afridi, A. Kumar, F. ibne Mahmood, G. Tamizhmani, Hotspot testing of glass/backsheet and glass/glass PV modules pre-stressed in extended thermal cycling, Sol. Energy 249, 467 (2023). https://doi.org/10.1016/j.solener.2022.12.006 [Google Scholar]
- G. Oreski, G.C. Eder, Y. Voronko, A. Omazic, L. Neumaier, W. Mühleisen, G. Ujvari, R. Ebner, M. Edler, Performance of PV modules using co-extruded backsheets based on polypropylene, Sol. Energy Mater. Sol. Cells 223, 110976 (2021). https://doi.org/10.1016/j.solmat.2021.110976 [Google Scholar]
- S. Mitterhofer, J. Slapšak, A. Astigarraga, D. Moser, G.O. Hernandez, P.V. Chiantore, W. Luo, Y.S. Khoo, J. Rabanal-Arabach, E. Fuentealba, P. Ferrada, M. Trigo Gonzalez, J. Ascencio-Vásquez, M. Topič, M. Jankovec, Measurement and simulation of moisture ingress in PV modules in various climates, IEEE J. Photovolt 14, 140 (2024). https://doi.org/10.1109/jphotov.2023.3323808 [Google Scholar]
Cite this article as: Bernhardt Käßer, Aline Kirsten Vidal de Oliveira, Oleksandr Mashkov, Lucas Nascimento, Ricardo Rüther, I. MariusPeters, Claudia Buerhop-Lutz, Strategy for simple, on-site failure analysis: investigating bubbles and burn marks in backsheets of PV modules, EPJ Photovoltaics 17, 7 (2026), https://doi.org/10.1051/epjpv/2025029
All Tables
Quantity of PV modules investigated using different methods, visual inspection (VIS), serial number scanning (SN), Infrared imaging (IR), UV fluorescence imaging (UVF), near infrared absorption spectroscopy (NIRA), electroluminescence (EL), current-voltage measurements (IV).
Correlating backsheet materials (PVDF–PET–PVDF (PVDF), FC–PET–FC (FC), PVF-PET-PVF (PVF), and PET–PE–PET or PET–PET–PE (PET)), carbonyl index (CI), water index (WI), and operation time with failure percentages.
All Figures
|
Fig. 1 Potential/observed consequences of (cyclic) shading: bubbles, blisters and burn marks. |
| In the text | |
|
Fig. 2 Typical positions of faults, top cell row on junction box side (a) and bottom cell row opposite junction box side (b), mapping of batches and marking modules with anomalies at the Brazil 1 site (c). |
| In the text | |
|
Fig. 3 Comparison of UVF and IR imaging for two modules. UVF image with 3 defects (a), IR image with two defects (b), with corresponding front and rear (images horizontally flipped) VIS. Numbers 1-5 identify the same areas. |
| In the text | |
|
Fig. 4 Two complementary techniques indicating elevated temperatures and faults in bottom cell rows for two different modules: UVF image of the two outer-most cell rows (negative for enhanced visibility) and corresponding mean intensity along horizontal and vertical axes of modules (a), EL-images showing inactive areas (b). |
| In the text | |
|
Fig. 5 Visualization of cell parts affected with anomalies (top and bottom row) for two exemplary PV modules I and II, from left to right: EL, VIS, UVF from the front and VIS from the rear (rear VIS images horizontally flipped). |
| In the text | |
|
Fig. 6 Calculated irradiances and shaded fractions in Brazil; shading fractions below 5% highlighted on 2024.06.01 (left); maximum irradiance and shading time below 5% throughout 2024 (right). |
| In the text | |
Current usage metrics show cumulative count of Article Views (full-text article views including HTML views, PDF and ePub downloads, according to the available data) and Abstracts Views on Vision4Press platform.
Data correspond to usage on the plateform after 2015. The current usage metrics is available 48-96 hours after online publication and is updated daily on week days.
Initial download of the metrics may take a while.