Fig. 4
Download original image
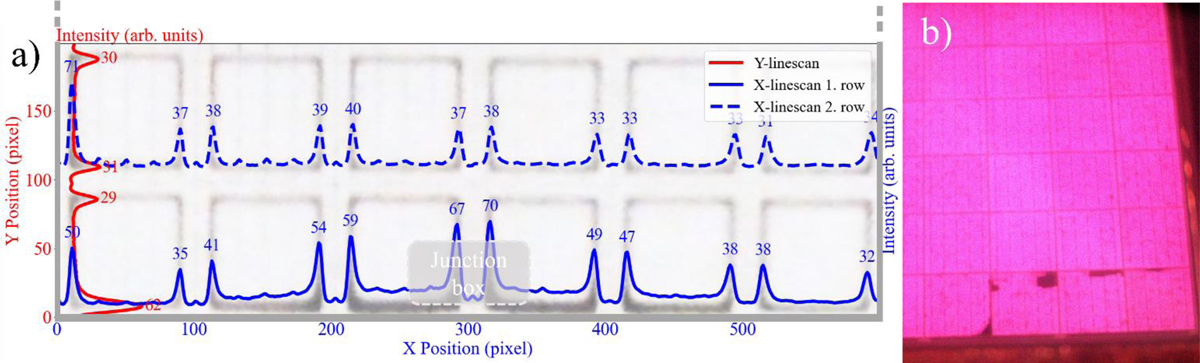
Two complementary techniques indicating elevated temperatures and faults in bottom cell rows for two different modules: UVF image of the two outer-most cell rows (negative for enhanced visibility) and corresponding mean intensity along horizontal and vertical axes of modules (a), EL-images showing inactive areas (b).
Current usage metrics show cumulative count of Article Views (full-text article views including HTML views, PDF and ePub downloads, according to the available data) and Abstracts Views on Vision4Press platform.
Data correspond to usage on the plateform after 2015. The current usage metrics is available 48-96 hours after online publication and is updated daily on week days.
Initial download of the metrics may take a while.