| Issue |
EPJ Photovolt.
Volume 17, 2026
Special Issue on ‘EU PVSEC 2025: State of the Art and Developments in Photovoltaics', edited by Robert Kenny and Carlos del Cañizo
|
|
|---|---|---|
| Article Number | 16 | |
| Number of page(s) | 18 | |
| DOI | https://doi.org/10.1051/epjpv/2026009 | |
| Published online | 10 April 2026 | |
https://doi.org/10.1051/epjpv/2026009
Original Article
Sustainability outlook for leading silicon photovoltaic technologies from 2023–2034 in Europe
1
School of Engineering, Physics and Mathematics, Northumbria University, Newcastle upon Tyne NE1 8ST, United Kingdom
2
School of Engineering, University of Birmingham, Edgbaston, Birmingham B15 2TT, United Kingdom
3
School of Engineering, University of Warwick, Coventry CV4 7AL, United Kingdom
4
Department of Materials, University of Oxford, Oxford OX1 3PH, United Kingdom
* e-mail: This email address is being protected from spambots. You need JavaScript enabled to view it.
Received:
30
June
2025
Accepted:
16
March
2026
Published online: 10 April 2026
Abstract
As Europe progresses toward a greener future, the years ahead bring expectations of widespread, large-scale photovoltaic (PV) deployment. Presently, mainstream silicon PV is transitioning away from the passivated emitter rear cell (PERC) architecture towards higher efficiency cell designs: tunnel oxide passivated contact (TOPCon) and silicon heterojunction (SHJ). With net-zero deadlines looming, there is an urgent need for comprehensive sustainability investigations into minimizing the environmental impact of large-scale actions before suffering avoidable consequences. Using life cycle assessment, these three silicon technologies are investigated and compared, finding SHJ to have the lowest global impact, closely followed by TOPCon. Both have lower impacts than PERC for 15 of 16 investigated environmental impact categories, including climate change (−9.9% and −12.1%, respectively), but increased metal use (+29.5% and +13.0%, respectively). A hotspot analysis identifies research opportunities for reducing environmental impacts such as material innovation through substituting silver (metallization) and ethylene vinyl acetate (encapsulant), or, more broadly, improving process efficiency and integrating more renewables into the electricity mix. The environmental impact is further evaluated to consider technological developments and evolving electricity mixes to the year 2034, showing the impacts of SHJ and TOPCon are reduced by >10% for all six identified high-value impact categories. These are then used to model European PV deployment between 2023 and 2034, considering various manufacturing scenarios, which show that this could result in climate change emissions of <0.41 Gt CO2 eq., though implementation of the Net-Zero Industry Act could reduce this to 0.31 Gt CO2 eq. Finally, sensitivity analysis is conducted to investigate uncertainty associated with modeling future impacts, comparing the 2024 and 2025 International Technology Roadmap for Photovoltaics. The sensitivity analysis results provide additional confidence in the findings of the initial comparison and support the conclusion that SHJ technology has, and will continue to have, the lowest environmental impact of the three investigated technologies.
Key words: Life cycle assessment / sustainability / environmental impact / silicon photovoltaics / manufacturing / forecast
© B.L. Willis et al., Published by EDP Sciences, 2026
 This is an Open Access article distributed under the terms of the Creative Commons Attribution License (https://creativecommons.org/licenses/by/4.0), which permits unrestricted use, distribution, and reproduction in any medium, provided the original work is properly cited.
1 Introduction
Wide-scale solar photovoltaic (PV) deployment is fundamental for achieving net-zero, and it is expected to be at the core of the renewable energy transition. Having recently surpassed 2 TW globally in 2024 [1], the scale of PV is predicted to reach values of up to 80 TW by 2050 [2,3] with the next decade considered a “crucial” period for PV development and deployment [4]. The European market for PV is the second largest in the world, following China, [5] with 16 countries each installing >1 GW PV capacity in 2024 [6]. Europe has introduced various strategies to ensure a stable and secure supply of PV and other renewable energy technologies, including the REPowerEU plan (2022), the Green Deal Industrial Plan (2023), and the Net-Zero Industry Act (NZIA) (2024). Collectively, these initiatives aim to diversify supply chains [7], provide funding and green skills [8], and establish a framework for European renewable technology manufacturing. One of the aims of the NZIA is for European manufacturing to supply >40% of the annual European renewable technology deployment [9], which will be considered as part of this work. This aims not only to reduce the reliance on offshore supply chains but also to minimize the environmental impact associated with offshore manufacturing [10].
Although PV deployment is necessary for mitigating climate change, PV's worldwide manufacturing and deployment have been found to have substantial environmental impact [11]. Previous work has shown that TW-scale production could spend ∼10% of the 1.5°C carbon emission budget set for the Paris Agreement [3], highlighting the need for more sustainable PV innovation. Meanwhile, the PV industry is undergoing an extraordinary period of research and development. In addition to exponential rate of installation, silicon PV is transitioning between cell designs in the search for higher efficiencies, low cost, and minimal environmental impact. Previous years have seen silicon technology develop from the aluminium back surface field (Al-BSF) design to the passivated emitter rear cell (PERC) design. Today there are multiple competitors for PERC's successor: the tunnel oxide passivated contact (TOPCon), silicon heterojunction (SHJ), interdigitated back contact (BC), and tandem architectures. It is still unclear which of these structures will ultimately dominate the market [12], though the International Technology Roadmap for PV (ITRPV) [13] has identified that TOPCon is expected to dominate the near future before being overturned by the SHJ design and subsequent BC and tandem designs. Research has comprehensively compared the efficiency and cost of these designs [14,15] but lacks extensive comparisons of their environmental impact.
The environmental impact of a product or process can be quantified through applying life cycle assessment (LCA), an internationally standardized methodology [16,17]. LCA considers material, energy, and waste flows from all stages of a product's life cycle to calculate various environmental impacts regarding climate change, ecosystems, human health, resources, and more. The way that an LCA is conducted can significantly affect the results due to differences such as system boundaries, impact assessment methodologies, functional units, and parameters—for this reason, transparency is an extremely important feature of LCA [18]. The most commonly adopted LCA system boundary for PV is cradle-to-gate (extraction to manufacturing) [19], with cradle-to-grave (includes end-of-life) and cradle-to-cradle (includes recycling) becoming increasingly more common due to more available data. For PV technologies, particularly silicon technologies, the manufacturing stage remains the most frequently identified part of the lifecycle responsible for the highest environmental impact, particularly the silicon purification and wafering parts of the manufacturing. Recent efforts have been effective in reducing the environmental impact associated with this stage such that carbon emissions have been halved over a relatively short period of time (6 yr) [20]. The silicon architecture transition has, historically, aligned with reducing the environmental impact associated with their manufacturing, with PERC having a lower environmental impact than Al-BSF [21] and both TOPCon [11,22] and SHJ [23] having an even lower environmental impact than PERC. As well as providing comparisons between technologies, these works apply LCA for identifying areas of high impact [22,23] or investigating different factors for ecodesign [24], such as silicon feedstock [25], module design [26,27], installation conditions [28], reshoring scenarios [10], and more. To the authors' knowledge, there are no comparisons between all three current mainstream silicon technologies: PERC, TOPCon, and SHJ, nor projections of the changing impact from all three technologies over the next 10 years. This is particularly important because previous literature has identified that the environmental impact is highly sensitive to the location of manufacturing [26] and the efficiency of the technology [29,30], both of which will change significantly during this time period—particularly in Europe.
This work looks to address this gap in the literature by comparing the three mainstream silicon technologies: PERC, TOPCon, and SHJ. Further, the way that this environmental impact is expected to change by 2034 due to technological developments and the integration of renewable energy resources into the electricity mix is investigated. The wide-scale deployment of these technologies to 2035 is then modeled for Europe, mirroring the technology market fluctuations, technological developments, and electricity mix changes for four manufacturing scenarios to estimate the cumulative environmental impact.
2 Materials and methods
2.1 Life cycle assessment of silicon technologies
This work provides an update to the modeling from previous work [11] by modifying it to consider European silicon PV deployment, and so there are similarities in the methodology. Assumptions are given in Supporting Information (Table S1). The aim of this LCA is to quantify the environmental impact of the three currently mainstream silicon technologies: PERC, TOPCon, and SHJ. Due to the importance of the coming 10 years, the decision has been made to restrict the LCA to a 10-year timeframe. This means the use and end-of-life stage is neglected since the module lifetime exceeds 10 years, resulting in a “cradle-to-market” system boundary [31,32], which considers the extraction of the raw materials, production of the PV module, and the transportation of the module to central Europe. The PV module production consists of three distinct stages: wafer production, cell fabrication, and the module component assembly (e.g., adding glass, encapsulant, etc.). This system boundary is demonstrated in Figure 1 using a TOPCon module as an example; note the cell fabrication stage is the main source of difference between technology types. The effect of the manufacturing equipment, including its fabrication, cleaning, and maintenance, is considered to lie beyond the scope of investigation for this study. To ensure the performance of each technology is considered in the comparison, the functional unit is chosen as 1 Wp.
The LCA was modeled in SimaPro v9.6.0.1 software and the impact assessment model Environmental Footprint (EF) v3.1 was used to investigate the environmental impact for 16 environmental impact categories: acidification, climate change, ecotoxicity—freshwater, particulate matter, eutrophication—marine, eutrophication—freshwater, eutrophication—terrestrial, human toxicity—cancer, human toxicity—non-cancer, ionising radiation, land use, ozone depletion, photochemical ozone formation, resource use—fossils (fossil use), resource use—minerals and metals (metal use), and water use. A definition of each impact category is available in the glossary.
Background data were obtained using the Ecoinvent v3.10, which contains all the emission flows required for the LCA. Ecoinvent v3.10 was also used to provide current electricity mix data, which is representative for 2023. Foreground data consists of primary and secondary data. The wafer production and the module components have been obtained from the literature data [26,33]. All modules considered in this work are assumed to be dual-glass with ethylene vinyl acetate (EVA) encapsulants. Previous work has compared dual-glass and glass-backsheet module designs [26,28], provided an environmental comparison between various backsheet materials [27], and compared encapsulation materials from an environmental perspective [34]. Transportation is assumed to be from the location of manufacturing (in this work, either China or Europe) to Central Europe and so has also been taken from the same inventory for consistency [26]. Existing literature was used for the TOPCon [11], PERC [26], and SHJ [35] cell fabrication inventories. These have been updated using the 2024 ITRPV [13] to make them temporally coherent with the TOPCon inventory, which is representative of 2023. The wafer production inventory from the literature [26] has also been modified such that the dopant now reflects the n-type wafers required for TOPCon and SHJ technologies as opposed to the p-type wafer used for PERC technology. In LCA, the results calculated through the EF v3.1 impact assessment methodology can be normalized to the average annual impact of a European; this allows for a comparison among impact categories to identify those that are the most significant. For transparency, data used for LCA and modeling are available in the Supporting Data.
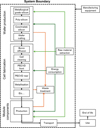 |
Fig. 1 Cradle-to-EU market system boundary applied to the LCA study. The cell fabrication stages relate specifically to TOPCon in this figure. (PECVD represents “plasma-enhanced chemical vapor deposition”.) |
2.2 Temporal projection
The ITRPV 2024 has also been used to modify each inventory to account for technological developments in estimating the future environmental impact of TOPCon and SHJ to 2034. The focus for this section is on TOPCon and SHJ, since these technologies will replace PERC and so hold the greatest opportunity to improve their sustainability—which can be identified through modelling their impact over the next 10 yr. The recently released edition of the roadmap ITRPV 2025 [36] is also used to provide a sensitivity analysis for some of the factors (efficiency and silver use) influencing these projections. As well as technological developments, the electricity mixes used to manufacture PV modules will change. In line with net-zero targets, countries will integrate more renewable energy technologies into their electricity mixes, lowering the carbon intensity and thus the environmental impact associated with PV module manufacturing. It is therefore crucial that this is considered in the model. To account for this, future electricity mix models have been constructed using the International Energy Outlook (IEO) 2023 data from the US Energy Information Administration (EIA) [37]. There is no existing model specifically for Europe alone (the IEO considers Europe and Eurasia, or Western Europe), and so we assume that future European module production will take place in Western Europe, which aligns with historical European PV manufacturing and the current PV manufacturing infrastructure available in Germany [6]. The low-zero-carbon technologies cost scenario has been adopted due to the expected increase in renewable energy technologies and simultaneous reduction in cost. To coincide with the forecasts in the ITRPV, a linear growth between the IEO data intervals has been assumed. This provides data for the years 2023, 2024, 2026, 2028, 2031, and 2034. The increased proportion of renewables in future electricity mixes is assumed to have no maximum penetration; from the IEO data, the maximum share of renewables in the future electricity mix is for Europe, 2035 (57% not including nuclear, 74% including nuclear). Battery storage is also not considered in this work.
2.3 Europe deployment modeling
The evolution of each cell technology and their individual environmental impacts are used to create a model to predict the environmental impact of PV deployment within Europe up to 2035. Installation data have been adopted from the EU Market Outlook for 2024–2028 [6] for forecasted growth in annual installations between 2024 and 2028. Beyond this, it is assumed that this 5% annual increase will continue between 2028 and 2035, in line with typical forecasted growth in the 2024–2028 EU Market Outlook. The additions are considered in phases, again to align with ITRPV data for the years 2023, 2024, 2026, 2028, 2031, and 2034. This model is used to investigate four scenarios: 100% of modules are manufactured in China, 100% of modules are manufactured in Europe, 60:40 China:Europe module manufacturing, and a gradual increase to 60:40 China:Europe manufacturing share by 2030 in line with the NZIA, referred to in this work as “gradual NZIA”. Here, the “gradual” NZIA scenario considers the growth toward a 60:40 manufacturing share between China and Europe before stabilizing in 2030 to represent the gradual set-up of European infrastructure required for PV module manufacturing, unlike the set 60:40 scenario, which is consistent over the time period. The share between manufacturing in China and manufacturing in Europe is detailed in the Supporting Data.
3 Results
3.1 Europe deployment modeling
The LCA data have been normalized to compare and identify the six highest value environmental impact categories, as shown in Figure 2. All source data are provided in the Supporting Data. The results show that, per Wp, PERC technology has the highest environmental impact for 15 of the 16 investigated environmental impact categories, with metal use being the only impact category to demonstrate a lower value than TOPCon and SHJ technologies. This suggests that the transition away from PERC and toward TOPCon and SHJ is beneficial overall for the environment and that the recovery or substitution of precious and scarce metals, such as silver, should be targeted to make these upcoming technologies have a lower impact universally. The raw results are available in the Supporting Information (Tab. S2), and Figure S1 shows all environmental impact categories. For these six categories presented in Figure 2, SHJ tends to have the lowest impact—although has the highest impact for metal use—which is the highest value category. Figure S2 compares the normalized results for TOPCon and SHJ cells in these six categories.
The transition from PERC to TOPCon or SHJ can result in decreases to the climate change impact category (kg CO2 eq.) by 9.9% or 12.1%, respectively. In this category, the silicon wafer has the greatest contribution, making up ∼40% of the climate change impact, due to the high consumption of electricity during the silicon purification and ingot growth processes. This is due to the large proportion of fossil-based electricity-generating resources within the electricity mix. This highlights the importance of improving the energy efficiency of these processes and decreasing wafer thickness, which would reduce the impact associated with a single wafer by increasing the process yield. Alternatively, more renewable electricity sources should be integrated into the electricity mix to reduce the climate change impact and the contribution from energy-intensive processes.
Eutrophication—freshwater and metal use are the two highest-value impact categories and show lower impacts for TOPCon technology than SHJ technology. When comparing the contribution from each of the 4 different stages (wafer, cell, module components, transport), it is found that the contribution from the cell is higher for SHJ than it is for TOPCon. This is primarily due to the metallization, which, for SHJ, has impact values 1.5 and 2.5 times larger than TOPCon in the eutrophication—freshwater and metal use categories, respectively. The use of silver is the root cause for concern regarding these impact categories due to its scarcity (metal use) and the harmful emissions associated with sulfidic tailings during silver mining (eutrophication—freshwater) highlighting it is a priority for impact reduction. SHJ cells use a larger quantity of silver than TOPCon cells, which causes this value to be higher and highlights the need for research into silver reduction or silver substitution. It is also very important that when an alternative material is used, such as copper, an LCA is conducted to ensure that the burden currently on these categories is not shifted onto another category, “burden shifting”.
For human toxicity—cancer, the module components' contribution is large (∼45% of the category) and is found to be predominantly from solar glass and the use of soda ash during its production. This could be a cause for concern with module design moving from glass backsheets toward dual-glass modules (as investigated here). However, the ITRPV suggests that thinner glass will gain market share in the future for both module designs, and this topic of reducing glass thickness is of high interest due to its substantial mass in comparison with the rest of the module, particularly with regulations regarding module weight during installation and single-person handling. For these reasons, a focus on alternative glass fabrication techniques and reducing glass thickness may become the focus of future research to minimize the module's impact and comply with regulations but also to ensure this is not at the expense of module durability.
Photochemical ozone formation is largely impacted by cell production (∼40%), with the largest contributing factor being the production of waste and emissions, particularly non-methane volatile organic compounds (NMVOC) and particulates <2.5 µm, for all technologies. The waste and direct emissions are assumed to be the same for each technology and are taken from literature [26], so the exact source of these emissions is unknown and may differ slightly in reality. Typically, these emissions have been associated with solvent use and cleaning processes [38], which highlights that process optimization during cell fabrication may be effective in reducing this impact. Additionally, wafer cleaning processes are changing from the standardized RCA method (considered here) to ozone cleaning [13], which would likely reduce the impact in this category due to the lower solvent use and waste. It is also worth noting that this may impact other categories, and an LCA should be conducted for both wafer cleaning processes to ensure the burden is not simply being shifted from one impact category onto another.
The impact category fossil use has a similar contribution from the wafer production and module components. The silicon wafer production is significant for reasons similar to the climate change category, resulting from the high energy-intensive processing required during silicon purification and ingot production, highlighting the same methods for impact reduction. The solar glass, as part of the module components, also has a high contribution due to being an energy-intensive process. Module components also include the EVA encapsulant required to protect the module from environmental factors, which would otherwise result in rapid degradation and module damage. This EVA is responsible for 23.6% of the module components' contribution toward this category and 9% of the overall category. This is because EVA is a polymer derived from fossil fuel resources, such as petroleum, resulting in a high fossil use impact. This means there is an opportunity to significantly reduce the fossil use impact by looking for alternative encapsulation materials or, alternatively, improving their end-of-life recovery. The impact of end-of-life processing on each impact category should be investigated in future work.
From this hotspot analysis, multiple research directions have been identified regarding different areas of the modules' manufacturing, demonstrating that there is ample opportunity to achieve impact reductions. These areas include larger-scale goals such as increasing the share of renewables in the electricity mix and improving process efficiency to minimize climate change and fossil use impacts, in addition to research-based areas such as alternative metallization or encapsulation materials to minimize metal use and eutrophication—freshwater or fossil use, respectively.
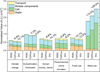 |
Fig. 2 Normalized LCA results comparing 1 Wp silicon technologies and showing relative percentage changes to 1 Wp PERC for the six highest impact categories. |
3.2 Temporal projection for TOPCon and SHJ
The results presented so far are representative of the technologies in the year 2023. Over time, the environmental impact associated with these technologies is expected to change. This is investigated for TOPCon and SHJ for the next 10 yr to 2034, as shown in Figure 3. To account for technological developments between 2023 and 2034, the ITRPV 2024 has been used to update module efficiency, reduced degradation, silver reduction, wafer thickness reduction, and polysilicon reduction per wafer. A current electricity mix for China, taken from the Ecoinvent v3.10 database (representative of 2023), is used to investigate how technological developments reduce the environmental impact of both technologies, shown by the solid line. Over this period, the evolving electricity mix is modeled from the IEO 2023 [37], together with technological developments, shown by the dashed line. The change in impact due to the energy transformation, neglecting any technological developments is not shown in the figure but the data is available in the Supporting Data file. This work investigates the impact of PV manufacturing for a baseline scenario considering manufacturing in China and transportation to Central Europe. Previous work [11] investigates this for TOPCon in various locations: China, India, USA, and Europe, finding that Europe was the lowest-impact manufacturing location. The same work also presents a sensitivity analysis of the impact of PV manufacturing on the electricity mix, a crucial factor to consider due to the variability in present renewable energy deployment.
Figure 3 shows more than a 10% decrease for all six high-value environmental impact categories due to technological developments between 2023 and 2034 for both TOPCon and SHJ technologies; this is much larger than the differences due to renewable energy integration alone (refer to Supporting Data—Tab “Fig 3”). Considering an increased share of renewables in the future electricity mix, although still decreasing the impact overall, this positive shift can still cause a slight increase in the environmental impact for some categories: Eutrophication—freshwater (Fig. 3b), human toxicity—cancer (Fig. 3c), and metal use (Fig. 3f) relative to today's electricity mix. These impacts may arise due to the difference between modelling the electricity mix from the IEO, 2023 [37], and the pre-made inventory from Ecoinvent. This concerns China's electricity mix in particular, as a significant proportion of the mix is expected to rely on the use of hard coal, which may differ between models. Another reason for increasing impact, as seen for metal use, can be because LCA also considers infrastructure (such as factories and distribution), which, for renewable energy technologies, tends to consist of more scarce resources or heavy metals than fossil-based infrastructures.
An interesting crossover in eutrophication—freshwater (Fig. 3b) happens in 2028/29, where SHJ becomes lower impact than TOPCon, demonstrating the fluidity of the results presented in Figure 2 and signifying the importance of including expected technological developments. This is the case for both current and future electricity mixes, suggesting that this difference is due to technological developments as opposed to the increased share of renewable resources in the mix. Further, this crossover may be due to the expected halted progress for TOPCon in the year 2028, whereas the SHJ technology is expected to continue with consistent wafer thickness innovation. Similarly, fossil use (Fig. 3e) has an overlap between current and future electricity mixes for TOPCon and SHJ technology. This suggests that the location of manufacturing (and the corresponding carbon intensity of the electricity mix) can influence which technology has the lower fossil use environmental impact. Hence, if a country with a more renewable electricity mix were to manufacture TOPCon, it could have a lower fossil use impact than SHJ manufactured in a country with a more fossil-fuel-based mix, despite TOPCon having a higher impact when using the same mix.
It is also important to highlight that while the difference between TOPCon and SHJ environmental impact is expected to converge for some impact categories, others are expected to diverge. Convergence is seen for metal use (Fig. 3f) due to the rapid development expected for silver reduction in SHJ technology. This difference in silver use between the technologies decreases from 40 mg/cell in 2023 to an expected 5 mg/cell by 2034 [13]. In reality, this forecast may change due to process or material innovation, such as silver dashing [39] or copper contacts [40], whereby another LCA would be necessary to evaluate the most sustainable of the two technologies, which lies beyond the scope of the present investigation. The broadening in impact difference observed for metal use between 2026 and 2028 is due to slightly slower innovation, as supported by ITRPV 2024, whereby the shape of this curve (Fig. 3f) mirrors the trend in the “amount of silver per cell” metallization figure from ITRPV 2024 [13]. Metal use also experiences the greatest decrease in impact over this 10-yr period for both TOPCon (25.9%) and SHJ (35.5%) from 2023 to 2034 using the current mix, making this convergence even more significant. Divergence of climate change (Fig. 3a), fossil use (Fig. 3e), and photochemical ozone formation (Fig. 3d) is due to the improvements in efficiency, which see a greater difference in 2034 (+0.4% efficiency) than 2023 (+0.2% efficiency), and wafer thickness reduction, where there is a larger difference in 2034 (15 µm) than 2023 (10 µm). Climate change and metal use impact categories show the largest change in impact over time due to technological development. The following section focuses on these two impact categories.
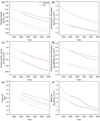 |
Fig. 3 Absolute LCA results (a–f) showing how the impact of 1 Wp TOPCon (red) and SHJ (blue) is expected to change between 2023 and 2034 considering technological developments for present (solid) and future (dashed) electricity mixes for the six highest value impact categories. The dotted line at the start of both scenarios represents data trends prior to 2026. |
3.3 Modelling European manufacture and deployment
Using the above models for PERC, TOPCon, and SHJ allows for the projection of the environmental impact into the future. Here, the deployment of silicon PV in Europe is investigated considering four scenarios: 100% manufacturing in China, 100% manufacturing in Europe, NZIA (consistent 60:40, China:Europe manufacturing), and “gradual” NZIA considering the gradual increasing share of European manufacturing to 60:40, China:Europe, by 2030. The cumulative impact for each scenario is shown in Figure 4 for the climate change and metal use environmental impact categories. The solid line in Figure 4 represents a constant electricity mix, representative of each location in 2023, while the dashed line represents an evolving electricity mix, also based on the low-zero-carbon cost scenario taken from the IEO, 2023 [37]. This work is modeled based on the assumption that Europe can reproduce the manufacturing capabilities of China; setting up the infrastructure is also considered to lie beyond the scope of this investigation [41]; though in reality it would require additional resources and result in additional environmental impact to set up an identical supply chain.
From Figure 4a and Figure 4b, it is shown that supply chain choices can significantly affect some environmental impact categories, such as climate change, while having a minor effect on other impact categories, such as metal use. LCA results show that European deployment of PV can result in up to 0.41 Gt CO2 eq., for the highest climate change impact supply chain. The lowest impact would be if all modules were manufactured in Europe, resulting in ∼0.26 Gt CO2 eq., with the additional opportunity to avoid 0.01 Gt CO2 eq. when considering Europe's increased share of renewables in the mix, in line with EIA expectations.
In line with the NZIA, there are aims to manufacture 40% of renewables deployed in Europe within Europe. To investigate the potential of this, a consistent 60:40 split between China and Europe manufacturing is assumed. This can result in 0.34 Gt CO2 eq. if a constant electricity mix is used and decrease to 0.31 Gt CO2 eq. if changes to the electricity mix are considered. At present, there is inadequate infrastructure within Europe to sustain 40% of PV module manufacturing, and so a more gradual increase toward the 60:40 manufacturing share is assumed in the “gradual NZIA” scenario. This “gradual NZIA” scenario shows that as the NZIA comes into practice, the climate change impact associated with European PV deployment can be reduced by 10.8% (relative to the impact of 100% manufacturing in China) to 0.36 Gt CO2 eq., assuming constant electricity mixes. When the “gradual NZIA” scenario is assumed for developing electricity mixes, the climate change impact is estimated to be 0.32 Gt CO2 eq. For metal use, the differences are much smaller (<2%), showing that for this impact, the location of manufacturing has little influence on the impact.
As well as manufacturing location, the differences in environmental impact between each technology type can cause the cumulative impact to fluctuate from the scenarios investigated. The data are plotted, assuming the PV deployment will be shared between the three technologies: PERC, TOPCon, and SHJ, according to the market projections taken from the ITRPV 2024. The dotted lines on Figure 4 show the upper and lower limits depending on manufacturing location and technology type. This provides an interesting insight for both impact categories. For climate change (Fig. 4a), the maximum cumulative environmental impact (over the next 10 yr) would be for a market of 100% PERC technology manufactured in China (0.46 Gt CO2 eq.), while the lowest would be a market of 100% SHJ technology manufactured in Europe (0.24 Gt CO2 eq.). For metal use (Fig. 4b), the reverse is true, with the maximum impact being for SHJ technologies manufactured in Europe (1.35E7 kg Sb eq.) and the lowest being PERC technologies manufactured in China (1.08E7 kg Sb eq.). This is useful for estimating the highest and lowest potential impacts from this deployment. It is important to note that in reality, 100% deployment of a single technology may not be practical due to material utilization, particularly for critical or scarce materials, as discussed in Section 4.1.
Initially, these results can imply that there is a very large, negative environmental impact from PV manufacturing and deployment, but this value needs to be benchmarked against the production of electricity from fossil fuels and against the environmental savings resulting from this PV deployment. First, the use of PV as opposed to using fossil-based resources is effective for mitigating climate change regardless of PV technology. The CO2 eq. emissions associated with energy production from renewables have been found to be at least one order of magnitude lower than the emissions associated with fossil-based energy [42]. This difference between fossil-based resources and PV is much larger than the CO2 eq. difference between PV technologies (which are on the scale of <1 g difference). Within this time period, the deployed PV can be expected to provide ∼6500 TWh electricity. This is assuming a relatively low insolation (1000 kWh/m2yr), monofacial modules, and only a small proportion of the PV lifetime (over their whole lifetime this value could be ∼34,000 TWh electricity or even larger when considering bifacial modules and higher insolation), making this estimation conservative. Knowing that 6500 TWh electricity will be produced by this PV between 2023 and 2035 allows for an estimation of avoided emissions. Using the expected future European electricity mix, generating 6500 TWh electricity would result in 1.88 Gt CO2 eq. This means that the (0.41 Gt) CO2 eq. emitted during the PV production will have already been offset and exceeded, paying back around 4.5 times the carbon emitted in the manufacturing in China scenario demonstrated here. This type of comparison strongly incentivizes the need for PV deployment, despite the environmental cost of manufacturing.
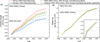 |
Fig. 4 Cumulative environmental impact due to silicon photovoltaic deployment within Europe, considering various manufacturing scenarios for (a) climate change and (b) metal use, considering present (solid) and future (dashed) electricity mixes. |
4 Discussion
4.1 Recycling and critical materials
This LCA modeling does not consider the recycling of or use of recycled materials. Although using recycled materials will minimize the need for extracting additional raw materials, this cannot be a primary solution to maintain sustainability due to PV modules' long lifetime, implying that minimizing material use is more effective for sustainable PV manufacturing [43]. Nevertheless, PV recycling is still a crucial step for improving PV sustainability [44], and research into their recycling is a rapidly growing area of interest, reflected by the upward trend in recent annual publications [45]. PV recycling is still in its infancy with underdeveloped technology, limited scalability, and extortionate cost compared to landfilling. The purpose of recycling is not only to replace the extraction of additional raw materials but also to reduce the environmental impact associated with the module. Unfortunately, recycling processes will contribute additional environmental impact through the use of electricity, solvents, and waste production, so it is crucial that the benefits of recycling outweigh the additional impacts.
Current PV recycling methods include mechanical, thermal, and chemical processing. These have previously been compared using LCA, finding mechanical processing to have the lowest environmental impact and chemical tending to have the largest [46]. The benefits (avoided burden) of each process are greater for chemical recycling than for mechanical processing, though in all cases the benefits outweigh the processing burdens. Green solvent recycling is being investigated to compete with the lower impact burdens from mechanical processing while maintaining the high yield and quality of recovered material achievable from chemical processing [46]. The difference in environmental impact has also been compared for upcycling and downcycling of materials [47]. Despite the difference in recovered material quality, mechanical recycling via shredding is the most common PV recycling method due to its low cost and adaptability [45]. This means common recycling fails to recover critical and/or scarce materials, such as silver and silicon, which could ultimately end up in landfills.
The benefits of recycling can be qualitatively (due to system boundary and LCA modeling choices) applied to this case study to provide insight into potentially avoidable burdens when these modules come to their end-of-life, assuming no further improvement to recycling technology. The effect on the climate change impact category is discussed. Assuming an average PV module has a mass of 18.5 kg [48] and a conservative power output of 300 Wp, the PV deployed within Europe during this time period would correspond to around 62 million tonnes of waste modules once they reach the end of their lifetime. If all this PV module waste were to be landfilled—the most common fate of PV waste today—this would result in an additional 1.2 Gt CO2 eq. [47]. A recent LCA of pilot-scale recycling found that their recycling process emits just 936 kg CO2 eq. per ton of module treated [49]. If this recycling process were applied to the PV modules considered in this study, just 0.06 Gt of CO2 eq. would be emitted (∼5% the impact of landfilling these modules). Additionally, the work compared emissions released from the recycling process to the emissions from conventional raw material production, reporting savings of 1065 kg CO2 eq. per ton of module treated. This demonstrates not only reduced impact from recycling versus landfilling but also potential savings of 0.07 Gt CO2 eq. by reusing recovered material (including copper, aluminium, glass, silicon, and silver) versus conventional extraction of new materials. This highlights the combined benefits of avoiding landfill and further extraction of raw materials from recycling. Some research also suggests that it may not be possible to eliminate the use of virgin materials during the renewable energy transition, and therefore lower carbon, conflict-free material sourcing should be targeted [30].
Although conventional recycling can recover materials, these are often of a poorer quality, making them unsuitable for direct reuse in new PV modules, and instead are downcycled. The unprecedented rate of expansion of the PV industry results in rapid resource consumption, with demand quickly approaching and potentially exceeding material availability [3,50]. Many materials used for manufacturing renewable energy technologies, including PV, are scarce, with some being deemed critical or strategic: silicon, indium, copper, and silver [51].
One such example is the silver commonly used for contact metallization. At a much lower production capacity in 2019 (∼100 GW) (∼42% of that in 2022 [52]), PV production consumed 10% of the global silver supply [43]. Between 2022 and 2050, annual silver demand is estimated to be 4–27 times that in 2022, varying substantially for each technology such that only PERC remains within reserve limits (550 kt) when assuming an optimistic PV scenario [50]. Supply chain vulnerability for these critical raw materials has been highlighted as high; relocating supply chains and reducing their use have been suggested in order to mitigate this vulnerability, whereas recycling or substitution are considered more limited solutions [53]. In line with this, to achieve more sustainable PV manufacturing, approaches for reducing, substituting, recovering, and recycling these crucial materials are intensifying. Among these are the development of silver-lean dashed contacts, requiring 7 mg/W silver per cell, a reduction of ∼40% relative to industrial cells, with marginal efficiency differences [39]; substituting silver for aluminium metallization, achieving a similar, 0.8% lower, efficiency to reference silver contact cells [54]; the development of new recycling processes and techniques capable of recovering high yields of high-quality materials [44] in more environmentally friendly ways [55]; and the testing of pilot lines for universal recycling processes improving the quality and recovery of critical and high-value materials [49].
Another material outside the scope of this LCA is bismuth, which is used for “SmartWire” technology. Bismuth SmartWire technology provides non-toxic, environmentally stable, and low-temperature-compatible interconnections to substitute silver busbars in SHJ technology [43,56,57]. Due to the availability of secondary data to provide an industrially validated inventory for SHJ cell technology, the use of SmartWire technology has been neglected. However, its use in SHJ technologies to substitute silver busbars, despite its scarcity, necessitates a discussion when considering material criticality. Bismuth is scarcer than silver and indium, and previous work has highlighted that ∼1 TW of solar cells adopting bismuth SmartWires technology would use >60% of the global bismuth supply (in 2019). Innovation in multibusbar technology and design is required to reduce this demand [56].
To avoid bottlenecks in PV production, further research should look to compare not only PV performance and sustainability of materials but also their criticality. While LCA can provide a comprehensive assessment of the environmental impacts, it does not fully address the criticality of raw materials [58], and the link between criticality and environmental sustainability is weak [59]. To overcome this, work has sought to integrate criticality assessment with LCA [60,61] by treating criticality as an economic indicator [59]; this use of economic importance and supply risk, in addition to resource depletion, will correctly assess the criticality of materials [58]. For this reason, materials such as indium have not been identified as an environmental hotspot in this work, despite previous work identifying indium as a potential bottleneck for PV production. Estimates suggest that only 330 GW annual PV production capacity could be sustained using 100% of the global supply of indium (in 2019) [43], and demand is expected to exceed available supplies [62]. Use of indium is important in PV due to its high transparency and electrical conductivity properties [63]. By 2050, annual indium demand is expected to increase by between 38 and 286 times that in 2022; however, this strongly depends on the technology choice, with PERC and TOPCon not limited by indium's supply [50]. To minimize supply risk, recovery and recycling of indium need to be investigated to lessen the demand on the raw supply chain [62]. Out of the three materials discussed, silver, bismuth, and indium, silver poses the greatest supply risk to PV production due to its universal usage across all technologies for metallization [56]. For the three discussed technologies, SHJ is restricted not only by the largest silver requirements but also by scarcity of indium and bismuth; material supply may limit this technology when reaching TW scale [43,56].
4.2 Sensitivity to the ITRPV predictions
The environmental impact of PV has been shown to undergo significant reductions over time due to technological advancements and renewable energy integration into the electricity mix. The impact reduction due to the expected rate of technological development has been investigated further by comparing the impact of TOPCon and SHJ PV using updated efficiency and silver use from the most recent 16th (ITRPV 2025) edition of the ITRPV. The estimates for efficiency and silver use from the 2024 ITRPV (square) and 2025 ITRPV (dot) are shown in Figure 5 for TOPCon (red) and SHJ (blue) technologies.
The datapoint for 2024 is of great interest because it shows the short-term expected technology improvement (within 1 yr) stated in the 2024 ITRPV, whereas in the 2025 ITRPV, the result for 2024 is the achieved value. This means that for both the efficiency and silver use estimates, the expected developments were met (SHJ) or exceeded (TOPCon). The comparison also shows that both efficiency and silver use have been updated in the 2025 ITRPV, indicating larger improvements than the estimates made in the 2024 ITRPV. This difference in estimates tends to be larger for SHJ, with differences of up to 1.2% additional efficiency and up to 2.5 mg/cell further reductions in silver use. The updated changes are larger in the silver use per cell (<16% relative percentage change) than for efficiency (<5% relative percentage change), suggesting more rapid innovation for silver use reduction than efficiency gains. The results suggest high short-term accuracy in the modeling based on the ITRPV. However, it should be noted that predictions made in the ITRPV have not always been correct [64], and so the actual forecast may differ from the values stated here, though the trend of data may be accurate. The importance of this section is to highlight the sensitivity of the impact of PV to these variables, measured using differences between these two ITRPV editions.
The influence on the environmental impact due to the fluctuations in the ITRPV projections for these variables isinvestigated through a sensitivity analysis as shown in Figure 6; the data are available in the Supporting Information. Here the environmental impact of TOPCon (red) and SHJ (blue) is compared for the 2024 ITRPV baseline (square-solid), used throughout this work, to the impact using updated estimates for either efficiency or silver use from the 2025 ITRPV (dot-dash). The same years have been modeled by assuming linear increments between each time period in the 2025 ITRPV to correlate with the years stated in the 2024 ITRPV. No datapoints for 2023 are provided in the 2025 ITRPV. This allows for easy comparison between expected progress (baseline, 2024 ITRPV) and actual improvement (updated 2025 ITRPV) as well as comparison between the expected improvements by 2034 from both roadmaps and the way that this affects the environmental impact.
The sensitivity analysis shows both technologies have similar environmental impacts to the baseline (2024 ITRPV) when updated (2025 ITRPV) silver-use values are used but larger differences when the updated (2025 ITRPV) efficiency values are used. This is the case for all six high-value impact categories except metal use that shows more variation. This observation, along with the knowledge that a greater percentage change is expected in the silver use values between each ITRPV edition, suggests that the environmental impact is more sensitive to the efficiency, highlighting this as a priority for environmental impact reduction. However, it is also known from this work that metal use is the highest-value environmental impact category, so efforts should seek to minimize this.
Metal use (Fig. 6f) is the only impact category to experience a lower impact from using updated silver use values compared to baseline and updated efficiency data. For the year 2028 it is seen that both technologies have a lower environmental impact as a consequence of updated silver use, rather than the updated efficiency improvements. By 2034, both updated improvements, if considered individually, can reduce the metal use impact by ∼2%.
For the climate change impact category (Fig. 6a), baseline TOPCon has a 2.0% higher environmental impact than baseline SHJ in 2024, and over time this difference is expected to increase to 4.5% by 2034. This difference in 2034 is expected to remain (when considering the updated silver use estimates) or reduce slightly to 4% when using updated efficiency estimates. This means that in the updated (2025) version of the ITRPV, the difference between TOPCon and SHJ impacts in 2034 is consistently reduced by 0.5% across all six impact categories.
The percentage change between the impact of TOPCon and the impact of SHJ in 2034 is found to be highest for the human toxicity—cancer (7.6%, Fig. 6c) and lowest for the photochemical ozone formation (2.9%, Fig. 6d) category. This is the case for each of the models: baseline, updated silver use, and updated efficiency. This consistency in the results across all 3 scenarios provides confidence in the main conclusions for this work by showing that SHJ technologies have a lower environmental impact than TOPCon for the majority of high-value impact categories and are expected to maintain this standard to 2035.
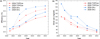 |
Fig. 5 Estimations taken from the 2024 ITRPV (square-solid) and 2025 ITRPV (dot-dash) for TOPCon (red) and SHJ (blue) technologies regarding (a) efficiency or (b) silver use estimates between 2024 and 2034. This considers cells of square M10 size (182 × 182 mm2). |
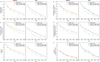 |
Fig. 6 Life cycle assessment results (a–f) for 1 Wp TOPCon (red) and SHJ (blue) technologies, using the ITRPV 2024 (square-solid), compared to the impact when using ITRPV 2025 (dot-dash) forecasts for efficiency (green) and silver use (yellow). This is done for the six highest-value impact categories. |
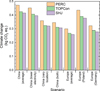 |
Fig. 7 Life cycle assessment results for various sub-grid manufacturing scenarios within China and Europe for the climate change category. |
4.3 Sensitivity to electricity mix and cell manufacturing
The electricity mix used to manufacture the PV modules has been shown to significantly affect the environmental impact associated with module production. So far, the work has provided a comparison between manufacturing locations using the “average” electricity mixes available from the Ecoinvent database, though in reality, manufacturers will be looking to reduce their environmental impact by using renewable energy resources during production, achieving a renewables share ∼50% [65,66]. A sensitivity analysis is conducted to consider this by using sub-grid electricity mixes—also taken from the Ecoinvent database, Figure 7. Manufacturing PV within China has been investigated and found to have the lowest impact if upstream manufacturing (wafer) is carried out in Yunnan and downstream manufacturing (module) in Jiangsu [22]; to replicate this scenario, Yunnan is considered as China's southwestern grid (CN-SWG in Ecoinvent), and Jiangsu is considered as China's eastern grid (CN-ECGC in Ecoinvent). This scenario is labeled as “China (vary location)”. Further, manufacturers are looking to minimize the electricity consumed during PV manufacturing [65]; this has been considered as a separate scenario “China (lower electricity),” which assumes a 4.27% decrease during mono-silicon production; 13.6% reduction during the wafer production; 26.0% reduction during the cell fabrication; and 19.1% reduction during the module production stage. An additional scenario is developed, “China (both),” which considers “China (vary location)” and “China (lower electricity)” together. Comparing these scenarios provides interesting insights and suggests that optimizing the supply chain within a region to use a more renewable electricity mix is more beneficial for minimizing the climate change impact than reducing the consumption of electricity (note that the additional transport between these locations has not been considered). Relative to the model used throughout this work (China (average)), the optimization of the manufacturing location within China can reduce the climate change emissions by 22.7–23.9% (for SHJ and PERC, respectively), whereas reducing the electricity consumed shows a reduction of 4.3–4.6% (for PERC and SHJ, respectively). Considering both scenarios shows that the reductions in electricity consumption in an already optimized manufacturing location can result in over a 25% reduction in the CO2 eq. emissions in total. The benefits of reducing electricity consumption in an optimized manufacturing location are slightly lower (2.9–3.2% reduction) than the benefits of reducing electricity consumption in a non-optimized location (2.3–4.6% reduction) due to the renewable energy mix of the optimized manufacturing location. Comparing “China (both)” to other sub-regions within Europe shows that the environmental impact achieved in China can be comparable to Germany (within 6.8–9.3%) or potentially lower (e.g., Poland, whose energy mix is dominated by coal, by 18.7–20.7%) than the impact of manufacturing in Europe. Interesting comparisons can also be made for each technology; for example, the results show that manufacturing TOPCon or SHJ within China under an optimized supply chain and reduced electricity consumption is lower impact than manufacturing PERC technology in “Europe (Germany),” showing that some technologies can have lower associated carbon emissions when manufactured in China than other technologies manufactured within Europe. This type of analysis is valuable for manufacturers looking to minimize their environmental impact to achieve environmental certifications for PV modules.
The impact of manufacturing can vary depending on the technological developments of different factors such as cell efficiency, electricity consumed during manufacturing, silver use, and the thickness of wafers. These four features have been investigated further through a sensitivity analysis that considered a 10% improvement for each of these, shown in Figure 8. This 10% improvement is considered as reasonable and achievable because the difference is within the projections of the ITRPV [13,36] (efficiency, silver use, wafer thickness) or within the limits of manufacturing sustainability reports [65,66] (electricity reduction).
Figure 8a shows that the improvement in efficiency effectively reduces the environmental impact in all six high environmental impact categories equally. This 10% efficiency increase results in an 8.9–9.1% decrease in all categories for each of the technologies. This is because the impact is directly related to the functional unit calculation (area/Wp), such that increasing efficiency reduces environmental impact. A 10% improvement in efficiency is most effective for reducing the impact of PERC. this is because PERC has the highest impact and the lowest efficiency, making the percentage increase in efficiency larger and a consequent larger reduction. Reducing the electricity consumed by 10% (Fig. 8b) has a more varied effect across the six highest impact categories, varying from a 0.08% reduction in metal use up to a 4.70% reduction in climate change. The results in this sensitivity resemble those in Figure 8d, although those in Figure 8d have slightly lower benefits (0.07–3.73%) than minimizing electricity consumption. This is because Figure 8b demonstrates electricity reductions throughout the full supply chain, whereas wafer thinning is only effective for minimizing the impact of upstream wafer processing. Despite this, most of the categories are dominated by the wafer, and this sensitivity suggests that specifically targeting the wafer thickness to minimize emissions is almost as effective as minimizing the electricity consumption throughout the full manufacturing process; this is due to the high contribution from the impact of electricity consumption during the wafer's fabrication. Figure 8c shows the percentage reductions in impact from reducing the use of silver by 10%; this is found to be the most effective for the metal use impact (4.27% for PERC—5.93% for SHJ) and much less effective for all the other 5 shown impact categories (0.06–1.06%). Cross-examining Figures 8a–8d shows that improving the efficiency is the most effective for universal impact reduction across all technologies. Alternatively, to reduce metal use, only silver reduction is useful, whereas if looking to reduce multiple impact categories minimizing electricity consumption or wafer thickness is more effective.
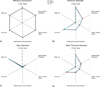 |
Fig. 8 Percentage reduction for the six highest impact categories when considering a 10% improvement in (a) efficiency, (b) electricity minimization, (c) silver reduction, and (d) wafer-thickness reduction. |
4.4 Future opportunity
This work has used an LCA of the three leading silicon technologies to model the environmental impact expected for PV deployment within Europe between 2023 and 2035. However, this model adopts a cradle-to-EU market system boundary to reflect the time period being investigated, so it does not consider the additional environmental impacts from the end-of-life treatment of the PV installation. Additionally, energy storage (batteries and renewable energy penetration), the balance of system components (such as the mounting structure and inverter), and impacts from the use phase (cleaning and maintenance) have not been considered. These should all be addressed in future work to provide a more complete representation of the environmental impact resulting from using and decommissioning PV. Further, the work here considers only the environmental sustainability of PV. To obtain a true understanding of the sustainability of this PV and its deployment, all three pillars of sustainability (environmental, economic, and social) should be evaluated as a whole. Through the sensitivity analysis, it has been shown that updates in the ITRPV can also affect the environmental impact of the PV further. To improve and investigate this in more depth, additional variables should be considered in the sensitivity, such as wafer thickness, glass thickness, and a potential change to copper contacts. The ITRPV also varies significantly in terms of the market. The modeling here has been based upon the 2024 ITRPV, which shows PERC, TOPCon, and SHJ hold a combined market share of 75% by 2034, though the 2025 ITRPV shows that this is reduced to a combined share of 52%. Although still a majority, the SHJ share is expected to be much smaller and displaced quickly by BC technologies. For this reason, BC and tandem devices will be included within this model in future work such that it reflect more accurately the expected composition of the future PV market. In the hotspot analysis, the EVA encapsulant is identified as a material of high impact. The ITRPV suggests that EVA encapsulation will be replaced by a mix of EVA and polyolefin elastomer (POE) materials; however, POE is not available within the Ecoinvent database and so has not been compared in this study. Previous work has investigated the impact of encapsulant alternatives, with one study comparing polyethylene terephthalate (PET) with EVA, establishing negligible environmental differences [34]. Constructing an accurate and reliable inventory for POEs and conducting this comparison using LCA should be a focus of future studies to ensure POEs are appropriate, lower-impact substitutes for EVA. Finally, further work could look to investigate supply chains for PV manufacturing within Europe. Optimizing the European PV supply chain could lead to significant environmental impact reduction—particularly with the NZIA becoming an important factor for renewable energy manufacturing within Europe. To improve the modeling further and provide a more complete comparison, China's rapid rate of decarbonization should be considered in future work. The present study has shown that increasing the share of renewables in the electricity mix can significantly reduce the impact of PV manufacturing, and China is expected to become a leader in the renewable energy transition [67]—consequently, in the future, PV manufacturing within China may be lower impact than manufacturing within Europe [67].
5 Conclusion
The work demonstrates that various silicon cell architectures can have significantly different environmental impacts. The results presented show that the transition away from PERC technology toward higher efficiency TOPCon and SHJ is also a more sustainable movement. Switching to TOPCon or SHJ results in environmental savings for 15 of the 16 investigated environmental impact categories, including a climate change reduction of 9.9% and 12.1%, respectively. This is at the expense of the metal use impact category, which increases for both TOPCon (13%) and SHJ (29.5%) due to the larger amount of silver required for silver contacts. Generally, SHJ was found to have the lowest environmental impact of the three investigated technologies. A hotspot analysis identifies the integration of more renewable electricity resources into the electricity mix and process optimization, as well as material innovation in the form of alternative metallization material to silver or EVA encapsulation, as some of the key areas of research interest to reduce the environmental impact across the six highest value impact categories: climate change, eutrophication—freshwater, human toxicity—cancer, photochemical ozone formation, fossil use, and metal use. Incorporating the ITRPV and IEO data into the model allows for estimates of the future impact of TOPCon and SHJ technologies between 2023 and 2034 by accounting for technological improvements and the integration of a higher share of renewables into the electricity mix. This modeling allows for comparison between technology developments and the integration of more renewables into the electricity mix and finds that the benefits from technology innovation largely outweigh the benefits of increasing the share of renewable energy used during the manufacturing. Using more renewable energy without technological developments could increase the metal use impact associated with PV manufacturing; this means combining both features is necessary for universal impact reductions. Considering both technological developments and renewable energy integration, reductions of >10% are expected for all six identified, high-value impact categories, with the greatest reductions in metal use (25.6–35.3%) and climate change (17.2–21.5%). This motivates a focus on these two categories when projecting the environmental impact of European deployment.
This deployment of PV can result in up to 0.41 Gt CO2 eq., assuming all modules are manufactured in China. If the NZIA is brought into immediate action with a gradual growth to 2030, this value could reduce to a range between 0.32and 0.36 Gt CO2 eq, though the lowest impact would be 0.26 Gt CO2 eq. under the scenario where all PV would be manufactured within Europe. For metal use, there is little difference between scenarios highlighting the fact that different environmental impact categories are affected differently. Finally, the sensitivity analysis shows that similar conclusions are obtained when considering the ITRPV 2025, indicating a high reliability of this work and that improvements in efficiency can significantly reduce the impact across all high-impact categories. It is important to remember that, although the results discussed throughout this study highlight the negative environmental impacts resulting from PV manufacturing and deployment, it is crucial that PV continues to be deployed on such a large scale to effectively mitigate climate change and achieve net zero. As previously shown, the deployment of PV within Europe may avoid ∼0.41 Gt CO2 eq. (4.5 times that spent to manufacture it), and the carbon emissions associated with electricity generation from PV are substantially lower than those emitted from the use of fossil-based resources regardless of the PV technology investigated in this study.
Glossary
Acidification - Describes the potential impact on the acidity of the air, water, and soil resulting from the emission of emissions (mol H+ eq.).
Climate change - Describes the potential contribution toward average global temperature increases due to greenhouse gas emissions (kg CO2 eq.).
Ecotoxicity— freshwater - Describes the potential toxic impact of emissions on microorganisms living in freshwater ecosystems (CTUe).
Particulate matter - Describes the potential impact on human health resulting from the emission of small particles (particulate matter) and its precursors to the atmosphere (disease inc.).
Eutrophication—marine - Describes the potential impact of excess nutrients in a marine ecosystem and their contribution to eutrophication (environmental degradation due to the depletion of oxygen in the ecosystem resulting from overgrowth of algae and plants stimulated by an excess of nutrients) (kg N eq.).
Eutrophication—freshwater - Describes the potential impact of excess nutrients in a freshwater ecosystem and their contribution to eutrophication (environmental degradation due to the depletion of oxygen in the ecosystem resulting from overgrowth of algae and plants stimulated by an excess of nutrients) (kg P eq.).
Eutrophication—terrestrial - Describes the potential impact of excess nutrients in a terrestrial ecosystem and their contribution to eutrophication (environmental degradation due to the depletion of oxygen in the ecosystem resulting from overgrowth of algae and plants stimulated by an excess of nutrients) (mol N eq.).
Human toxicity—cancer - Describes the potential impact on human health caused by exposure to chemicals and substances that increase the risk of cancer (CTUh).
Human toxicity— non-cancer - Describes the potential impact on human health caused by exposure to chemicals and substances that may cause non-cancerous health effects (CTUh).
Ionising radiation - Describes the potential impact on human health due to exposure to radioactive substances (kBq U-235 eq.).
Land use - Describes the impact of land transformation and potential changes to soil quality (Pt).
Ozone depletion - Describes the potential damage to the ozone layer resulting from emissions that deplete and damage the ozone layer (kg CFC11 eq.).
Photochemical ozone formation - Describes the potential impact on organisms as a result of ozone emissions in the lower atmosphere (troposphere) (kg NMVOC eq.).
Resource use— fossils (Fossil use) - Describes the consumption and depletion of non-renewable, fossil fuel resources (MJ).
Resource use—minerals and metals (Metal use) - Describes the consumption and depletion of non-renewable, non-fossil resources like minerals and metals (kg Sb eq.).
Water use - Describes the impact of depleting water from natural sources (m3 depriv.).
Acknowledgments
The authors would like to thank Kyle Affleck for their support and useful discussions in regard to this work.
Funding
This research was funded by the Engineering and Physical Sciences Research Council in the UK through grants EP/S023836/1 (B.L.W., EPSRC Centre for Doctoral Training in Renewable Energy Northeast Universities) and EP/W010062/1 (O.M.R., N.S.B., EPSRC Reimagining Photovoltaics Manufacturing). The work was also supported by the EPSRC Charged Oxide Inversion Layer (COIL) solar cells project (EP/V037749/1 and EP/V038605/1). S.L.P. was supported by a Royal Academy of Engineering Research Fellowship (RF-2324-23-197).
Conflicts of interest
The authors have nothing to disclose.
Data availability statement
All data related to this work are available in the Supporting Data and Supporting Information.
Author contribution statement
Conceptualization, B.L.W., O.M.R. and N.S.B.; Methodology, B.L.W., O.M.R. and N.S.B.; Software, B.L.W.; Validation, S.L.P., N.E.G., J.D.M. and R.S.B.; Formal Analysis, B.L.W.; Investigation, B.L.W.; Resources, B.L.W., O.M.R. and R.S.B.; Data Curation, B.L.W.; Writing—Original Draft Preparation, B.L.W.; Writing—Review & Editing, O.M.R., S.L.P., N.E.G., J.D.M., R.S.B. and N.S.B.; Visualization, B.L.W., O.M.R. and N.S.B.; Supervision, J.D.M., R.S.B. and N.S.B.; Project Administration, R.S.B. and N.S.B.; Funding Acquisition, J.D.M., R.S.B., S.L.P., and N.S.B.
Supplementary Material
All source data and parameters are provided in the Supporting Data.
Figure S1: Normalised LCA results comparing 1 Wp silicon technologies and showing relative percentage changes to 1 Wp PERC for all investigated impact categories.
Figure S2: Normalised LCA results comparing 1 Wp silicon technologies and showing relative percentage changes to 1 Wp PERC for the six highest impact categories.
Table S1: Assumptions used throughout this work.
Table S2: Raw LCA results comparing 1 Wp manufacturing of PERC, TOPCon and SHJ in China and transported to Central Europe.
Access Supplementary MaterialReferences
- Global Solar Council, Global Solar Council announces 2 terawatt milestone achieved for solar. https://www.globalsolarcouncil.org/news/global-solar-council-announces-2-terawatt-milestone-achieved-for-solar/. (accessed 15 February, 2025) [Google Scholar]
- N.M. Haegel et al., Photovoltaics at multi-terawatt scale: waiting is not an option, Science 380, 39 (2023) [CrossRef] [PubMed] [Google Scholar]
- J.C. Goldschmidt, L. Wagner, R. Pietzcker, L. Friedrich, Technological learning for resource efficient terawatt scale photovoltaics, Energy Environ. Sci. 14, 5147 (2021) [CrossRef] [Google Scholar]
- N.M. Haegel, Photovoltaics at the Cusp: global growth and learning, Silicon Photovoltaics Conference, Oral Presentation (2025) [Google Scholar]
- IEA PVPS, 2025 Snapshot of Global Photovoltaic Markets, 2025. Available: https://iea-pvps.org/snapshot-reports/snapshot-2025/ [Google Scholar]
- Solar Power Europe, EU Market Outlook for Solar Power 2024–2028, 2024 [Google Scholar]
- European Commission, Communication from the commission to the European Perliament, The European Council, The European Economic and Social Committee and the Committee of the Regions, REPowerEU Plan. European Union. https://eur-lex.europa.eu/legal-content/EN/TXT/?uri=COM%3A2022%3A230%3AFIN&qid=1653033742483 (accessed 20 May, 2025) [Google Scholar]
- European Commission, The Green Deal Industrial Plan, European Union. https://commission.europa.eu/strategy-and-policy/priorities-2019-2024/european-green-deal/green-deal-industrial-plan_en (accessed 20 May 2025) [Google Scholar]
- European Commission, Factsheet: Net Zero Industry Act. European Union. https://ec.europa.eu/commission/presscorner/detail/en/fs_23_1667 (accessed 20 May 2025) [Google Scholar]
- H. Liang, F. You, Reshoring silicon photovoltaics manufacturing contributes to decarbonization and climate change mitigation, Nat. Commun. 14, 1274 (2023) [Google Scholar]
- B.L. Willis et al., Maximising environmental savings from silicon photovoltaics manufacturing to 2035, Nat. Commun. 17, 2311 (2026) [Google Scholar]
- J.C. Blakesley et al., Roadmap on established and emerging photovoltaics for sustainable energy conversion, J. Phys. Energy 6, 041501 (2024) [Google Scholar]
- Verband Deutscher Maschinen und Anlagenbau (VDMA), International Technology Roadmap for Photovoltaics (ITRPV); 15th Edition, in ITRPV, VDMA, VDMA, 2024. Available: https://www.vdma.org/international-technology-roadmap-photovoltaic [Google Scholar]
- C. Ballif, F.-J. Haug, M. Boccard, P.J. Verlinden, G. Hahn, Status and perspectives of crystalline silicon photovoltaics in research and industry, Nat. Rev. Mater. 7, 597 (2022) [CrossRef] [Google Scholar]
- M. Fazal, S. Rubaiee, Progress of PV cell technology: Feasibility of building materials, cost, performance, and stability, Sol. Energy 258, 203 (2023) [Google Scholar]
- ISO 14040, Environmental management—Life cycle assessment—Principles and framework, ISO, 2006. Available: https://www.iso.org/standard/37456.html [Google Scholar]
- ISO 14044, Environmental management—Life cycle assessment—Requirements and guidelines (ISO, 2006). Available: https://www.iso.org/obp/ui/#iso:std:iso:14044:ed-1:v1:en [Google Scholar]
- V. Fthenakis et al., Methodology guidelines on life cycle assessment of photovoltaic electricity, IEA PVPS Task 12 (2011) [Google Scholar]
- V. Muteri et al., Review on life cycle assessment of solar photovoltaic panels, Energies 13, 252 (2020) [Google Scholar]
- V. Fthenakis, E. Leccisi, Updated sustainability status of crystalline silicon based photovoltaic systems: Life cycle energy and environmental impact reduction trends, Prog. Photovolt. Res. Appl. 29, 1068 (2021) [Google Scholar]
- A. Danelli, E. Brivio, P. Girardi, N. Baggio, J. Libal, Environmental life cycle assessment of passivated emitter and rear contact (perc) photovoltaic module technology, IEA PVPS Task 12 (2024) [Google Scholar]
- Z. Wang, Y. Liu, F. Gao, B. Sun, X. Gong, Z. Nie, Environmental impact assessment of the manufacture and use of N-type and P-type photovoltaic modules in China, J. Clean. Prod. 470, 143187 (2024) [Google Scholar]
- A. Louwen, W. Van Sark, R. Schropp, W. Turkenburg, A. Faaij, Life cycle greenhouse gas emissions and energy payback time of current and prospective silicon heterojunction solar cell designs, Prog. Photovolt. Res. Appl. 23, 1406 (2015) [Google Scholar]
- T. Béjat et al., Design for the environment: SHJ module with ultra low carbon footprint, Prog. Photovolt. Res. Appl. 33, 184 (2025) [Google Scholar]
- M.M. Lunardi, J. Alvarez-Gaitan, N.L. Chang, R. Corkish, Life cycle assessment on PERC solar modules, Sol. Energy Mater. Sol. Cells 187, 154 (2018) [CrossRef] [Google Scholar]
- A. Müller, L. Friedrich, C. Reichel, S. Herceg, M. Mittag, D.H. Neuhaus, A comparative life cycle assessment of silicon PV modules: impact of module design, manufacturing location and inventory, Sol. Energy Mater. Sol. Cells 230, 111277 (2021) [CrossRef] [Google Scholar]
- P. de Wild, M. de Wild Scholten, I. Goudswaard, Life cycle assessment of photovoltaic module backsheets, Prog. Photovolt. Res. Appl. 31, 1227 (2023) [Google Scholar]
- X. Jia, C. Zhou, Y. Tang, W. Wang, Life cycle assessment on PERC solar modules, Sol. Energy Mater. Sol. Cells 227, 111112 (2021) [CrossRef] [Google Scholar]
- S. Resalati, T. Okoroafor, A. Maalouf, E. Saucedo, M. Placidi, Life cycle assessment of different chalcogenide thin-film solar cells, Appl. Energy 313, 118888 (2022) [Google Scholar]
- H. Mirletz, S. Ovaitt, S. Sridhar, T.M. Barnes, Prioritizing circular economy strategies for sustainable PV deployment at the TW scale, EPJ Photovoltaics 15, 18 (2024) [Google Scholar]
- A.A. Khan et al., The European Union's Ecodesign Directive–analysis of carbon footprint assessment methodology and implications for photovoltaic module manufacturers, Sol. RRL 8, 2301011 (2024) [Google Scholar]
- D. Polverini, N. Espinosa, U. Eynard, E. Leccisi, F. Ardente, F. Mathieux, Assessing the carbon footprint of photovoltaic modules through the EU Ecodesign Directive, Sol. Energy 257, 1 (2023) [CrossRef] [Google Scholar]
- R. Frischknecht et al., Life cycle inventories and life cycle assessment of photovoltaic systems, International Energy Agency (IEA) PVPS Task 12, Report T12-19:2020, 2020 [Google Scholar]
- A.B. Paç, A. Gok, Assessing the environmental benefits of extending the service lifetime of solar photovoltaic modules, Glob. Chall. 8, 2300245 (2024) [Google Scholar]
- M. Roffeis et al., New insights into the environmental performance of perovskite-on-silicon tandem solar cells—a life cycle assessment of industrially manufactured modules, Sustain. Energy Fuels 6, 2924 (2022) [Google Scholar]
- Verband Deutscher Maschinen und Anlagenbau (VDMA), International Technology Roadmap for Photovoltaics (ITRPV); 16th Edition, in ITRPV, VDMA, 2025 https://www.vdma.eu/en/international-technology-roadmap-photovoltaic [Google Scholar]
- US Energy Information Administration (EIA), International Energy Outlook 2023, Vol. 2024, 2023. Available: https://www.eia.gov/outlooks/ieo/pdf/IEO2023_Narrative.pdf [Google Scholar]
- UK Gov, Department for Environment, Food and Rural Affairs, Emissions of air pollutants in the UK - Non-methane volatile organic compounds (NMVOCs). https://www.gov.uk/government/statistics/emissions-of-air-pollutants/emissions-of-air-pollutants-in-the-uk-non-methane-volatile-organic-compounds-nmvocs (accessed 20 May, 2025) [Google Scholar]
- Y. Zhang et al., Silver-lean screen-printing metallisation for industrial TOPCon solar cells: enabling an 80% reduction in silver consumption, Sol. Energy Mater. Sol. Cells 288, 113654 (2025) [Google Scholar]
- S. Kluska et al., Enabling savings in silver consumption and poly-Si thickness by integration of plated Ni/Cu/Ag contacts for bifacial TOPCon solar cells, Sol. Energy Mater. Sol. Cells 246, 111889 (2022) [Google Scholar]
- P. Brailovsky, L. Sanchez, D. Subasi, J. Rentsch, R. Preu, S. Nold, Photovoltaic manufacturing factories and industrial site environmental impact assessment, Energies 17, 2540 (2024) [Google Scholar]
- G. Guidi, A.C. Violante, S. De Iuliis, Environmental impact of electricity generation technologies: a comparison between conventional, nuclear, and renewable technologies, Energies 16, 7847 (2023) [CrossRef] [Google Scholar]
- M. Kim, Y. Zhang, P. Verlinden, B. Hallam, Towards sustainable silicon PV manufacturing at the terawatt level, AIP Conf. Proc. 2487, 090001 (2022) [Google Scholar]
- P. Padhamnath et al., Development of PV panel recycling process enabling complete recyclability of end-of-life silicon photovoltaic panels, Sol. Energy Mater. Sol. Cells 286, 113571 (2025) [Google Scholar]
- International Energy Agency (IEA), Advances in Photovoltaic Module Recycling, 2024. Available: https://iea-pvps.org/wp-content/uploads/2024/06/IEA-PVPS-T12-28-2024-Report-PV-Recycling-LCI_EPRI.pdf [Google Scholar]
- Y. Duan, F. Guo, Z. Huang, J. Gardy, X. Jiang, C. Li, Life cycle assessment of recycling waste crystalline silicon photovoltaic modules: a comparison between traditional and green solvent recycling processes, Chem. Eng. J. 500, 157132 (2024) [Google Scholar]
- D. Mao et al., Overview of life cycle assessment of recycling end-of-life photovoltaic panels: case study of crystalline silicon photovoltaic panels, J. Clean. Prod. 434, 140320 (2024) [Google Scholar]
- M. Sodhi, L. Banaszek, C. Magee, M. Rivero-Hudec, Economic lifetimes of solar panels, Procedia CIRP 105, 782 (2022) [Google Scholar]
- H.-H. Fan, C. Salas-Redondo, A. Chalaux, Life cycle assessment of an innovative high-value-recovery crystalline silicon photovoltaic recycling process—the environmental impacts and benefits, EPJ Photovoltaics 15, 35 (2024) [Google Scholar]
- C. Xu, O. Isabella, M.R. Vogt, Future material demand for global silicon-based PV modules under net-zero emissions target until 2050, Resour. Conserv. Recycl. 210, 107824 (2024) [Google Scholar]
- E. Commission, Directorate-General for Internal Market, Entrepreneurship, and SMEs, Study on the critical raw materials for the EU 2023—Final report (Publications Office of the European Union, 2023) [Google Scholar]
- International Energy Agency, Trends in photovoltaic applications, 2023. Available: https://share.google/JdFUHDgGeqrahc9v6 [Google Scholar]
- J. Mertens et al., From emissions to resources: mitigating the critical raw material supply chain vulnerability of renewable energy technologies, Miner. Econ. 37, 669 (2024) [Google Scholar]
- Y. Cheng et al., Integration of aluminum contacts in TOPCon solar cells: a pathway to reduce silver usage, Sol. Energy Mater. Sol. Cells 285, 113559 (2025) [CrossRef] [Google Scholar]
- N. Li et al., Efficient silver leaching from end-of-life photovoltaic panels via a catalyst-free peroxymonosulfate process, Resour. Conserv. Recycl. 229, 108863 (2026) [Google Scholar]
- Y. Zhang, M. Kim, L. Wang, P. Verlinden, B. Hallam, Design considerations for multi-terawatt scale manufacturing of existing and future photovoltaic technologies: challenges and opportunities related to silver, indium and bismuth consumption, Energy Environ. Sci. 14, 5587 (2021) [CrossRef] [Google Scholar]
- Y. Cui, L. Yang, X. Wu, J. Deng, X. Zhang, J. Zhang, Recent progress of lead-free bismuth-based perovskite materials for solar cell applications, J. Mater. Chem. C 10, 16629 (2022) [Google Scholar]
- R.S. Pell, F. Wall, X. Yan, G. Bailey, Applying and advancing the economic resource scarcity potential (ESP) method for rare earth elements, Resour. Policy 62, 472 (2019) [Google Scholar]
- D. Perossa, P. Rosa, S. Terzi, A systematic literature review of existing methods and tools for the criticality assessment of raw materials: a focus on the relations between the concepts of criticality and environmental sustainability, Resources 13, 131 (2024) [Google Scholar]
- I. Hackenhaar et al., A critical review of criticality methods for a European Life Cycle Sustainability Assessment, Procedia CIRP 105, 428 (2022) [Google Scholar]
- J. Vogtländer, D. Peck, D. Kurowicka, The eco-costs of material scarcity, a resource indicator for LCA, derived from a statistical analysis on excessive price peaks, Sustainability 11, 2446 (2019) [Google Scholar]
- H.U. Sverdrup, O. van Allen, H.V. Haraldsson, Modeling indium extraction, supply, price, use and recycling 1930–2200 using the WORLD7 model: implication for the imaginaries of sustainable Europe 2050, Nat. Resour. Res. 33, 539 (2024) [Google Scholar]
- L. Wang et al., Sustainability evaluations on material consumption for terawatt scale manufacturing of silicon based tandem solar cells, Prog. Photovolt. Res. Appl. 31, 1442 (2023) [Google Scholar]
- P. Baliozian et al., The international technology roadmap for photovoltaics and the significance of its decade-long projections, in 37th European PV Solar Energy Conference and Exhibition (2020), Vol. 7, p. 11 [Google Scholar]
- LONGi, LONGi Sustainability Report 2024, 2024. Available: https://static.longi.com/2024_LON_Gi_Sustainability_Report_5edfa81533_1741819857.pdf [Google Scholar]
- Jinko, Jinko Sustainability Report 2024, 2024. Available: https://jinkosolar.eu/wp-content/uploads/2025/07/JinkoSolar-ESG-Report-2024.pdf [Google Scholar]
- International Energy Agency, Renewables 2024, IEA Reports, 2024. [Online]. Available: https://www.iea.org/reports/renewables-2024 [Google Scholar]
Cite this article as: Bethany L. Willis, Oliver M. Rigby, Sophie L. Pain, Nicholas E. Grant, John D. Murphy, Ruy S. Bonilla, Neil S. Beattie, Sustainability Outlook for Leading Silicon Photovoltaic Technologies from 2023-2034 in Europe, EPJ Photovoltaics 17, 16 (2026), https://doi.org/10.1051/epjpv/2026009
All Figures
|
Fig. 1 Cradle-to-EU market system boundary applied to the LCA study. The cell fabrication stages relate specifically to TOPCon in this figure. (PECVD represents “plasma-enhanced chemical vapor deposition”.) |
| In the text | |
|
Fig. 2 Normalized LCA results comparing 1 Wp silicon technologies and showing relative percentage changes to 1 Wp PERC for the six highest impact categories. |
| In the text | |
|
Fig. 3 Absolute LCA results (a–f) showing how the impact of 1 Wp TOPCon (red) and SHJ (blue) is expected to change between 2023 and 2034 considering technological developments for present (solid) and future (dashed) electricity mixes for the six highest value impact categories. The dotted line at the start of both scenarios represents data trends prior to 2026. |
| In the text | |
|
Fig. 4 Cumulative environmental impact due to silicon photovoltaic deployment within Europe, considering various manufacturing scenarios for (a) climate change and (b) metal use, considering present (solid) and future (dashed) electricity mixes. |
| In the text | |
|
Fig. 5 Estimations taken from the 2024 ITRPV (square-solid) and 2025 ITRPV (dot-dash) for TOPCon (red) and SHJ (blue) technologies regarding (a) efficiency or (b) silver use estimates between 2024 and 2034. This considers cells of square M10 size (182 × 182 mm2). |
| In the text | |
|
Fig. 6 Life cycle assessment results (a–f) for 1 Wp TOPCon (red) and SHJ (blue) technologies, using the ITRPV 2024 (square-solid), compared to the impact when using ITRPV 2025 (dot-dash) forecasts for efficiency (green) and silver use (yellow). This is done for the six highest-value impact categories. |
| In the text | |
|
Fig. 7 Life cycle assessment results for various sub-grid manufacturing scenarios within China and Europe for the climate change category. |
| In the text | |
|
Fig. 8 Percentage reduction for the six highest impact categories when considering a 10% improvement in (a) efficiency, (b) electricity minimization, (c) silver reduction, and (d) wafer-thickness reduction. |
| In the text | |
Current usage metrics show cumulative count of Article Views (full-text article views including HTML views, PDF and ePub downloads, according to the available data) and Abstracts Views on Vision4Press platform.
Data correspond to usage on the plateform after 2015. The current usage metrics is available 48-96 hours after online publication and is updated daily on week days.
Initial download of the metrics may take a while.