Fig. 6
Download original image
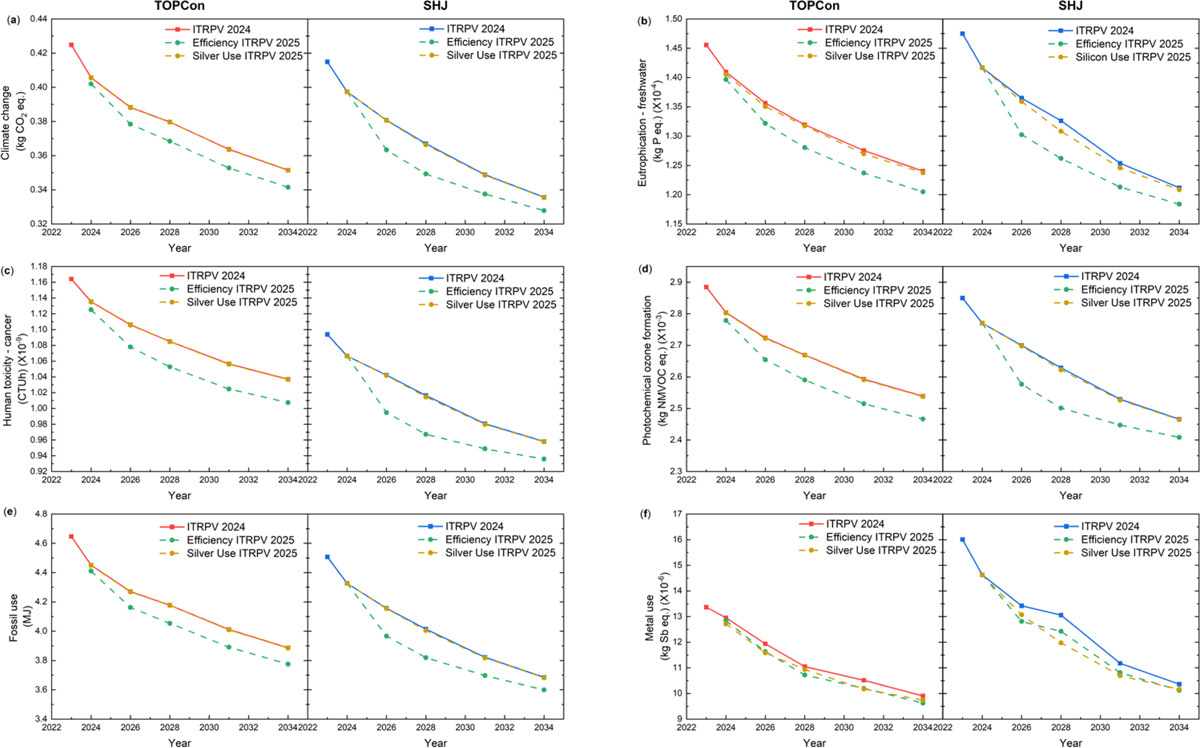
Life cycle assessment results (a–f) for 1 Wp TOPCon (red) and SHJ (blue) technologies, using the ITRPV 2024 (square-solid), compared to the impact when using ITRPV 2025 (dot-dash) forecasts for efficiency (green) and silver use (yellow). This is done for the six highest-value impact categories.
Current usage metrics show cumulative count of Article Views (full-text article views including HTML views, PDF and ePub downloads, according to the available data) and Abstracts Views on Vision4Press platform.
Data correspond to usage on the plateform after 2015. The current usage metrics is available 48-96 hours after online publication and is updated daily on week days.
Initial download of the metrics may take a while.