| Issue |
EPJ Photovolt.
Volume 16, 2025
Special Issue on ‘EU PVSEC 2024: State of the Art and Developments in Photovoltaics’, edited by Robert Kenny and Gabriele Eder
|
|
|---|---|---|
| Article Number | 26 | |
| Number of page(s) | 23 | |
| DOI | https://doi.org/10.1051/epjpv/2025014 | |
| Published online | 03 June 2025 | |
https://doi.org/10.1051/epjpv/2025014
Original Article
Reducing process time of PV module lamination by using double-side heating system
1
RCT Solutions GmbH, Line-Eid-Str. 1, 78467 Konstanz, Germany
2
Fraunhofer Institute for Solar Energy Systems ISE, Heidenhofstr. 2, 79110 Freiburg, Germany
3
Robert Buerkle GmbH, Stuttgarter Str. 123, 72250 Freudenstadt, Germany
* e-mail: This email address is being protected from spambots. You need JavaScript enabled to view it.
Received:
30
June
2024
Accepted:
22
April
2025
Published online: 3 June 2025
Abstract
Non-optimized encapsulation parameters, set during the lamination process, can be a cause of multiple failure modes for PV modules in the field. This paper investigates the influence of a double-side heating system in the lamination process for a glass-backsheet PV module. This effect was evaluated by comparing the gel content of encapsulants treated with different heating methods, including single-side and double-side heating systems. Towards this goal, forty different lamination process recipes are tested using various temperatures and process times to compare the gel content of the ethylene vinyl acetate (EVA) encapsulant and find the fastest possible lamination process. The gel content is determined using Soxhlet extraction, while the degree of crosslinking is assessed using differential scanning calorimetry (DSC), and the results are compared. The results show that double-side heating can shorten the process time by 10% to 30%. Furthermore, the paper examines the potential of reducing the process time by performing temperature uniformity measurements during the process and laminating full-size modules for visual inspection using a double-side heating system. It was found that temperatures above 165 °C can be used for a stable lamination process using EVA encapsulant and polyethylene terephthalate (PET) based polymer backsheet. Based on the above results, a five-minute one-step single-press lamination process plus cooling is demonstrated. Long-term stability and safety tests are further studied according to IEC 61215-2 and IEC 61730-2 standards, respectively. The modules successfully passed the standard qualification tests, including thermal cycling, damp-heat, and mechanical load tests following damp-heat exposure, with a maximum power degradation (PMPP) of less than 2%. All the insulation characterizations, including the dry insulation test and wet leakage current test, were also successfully completed following the safety tests, which included sequence B and sequence B1.
Key words: Lamination / glass-backsheet / gel content / crosslinking / double-side heating / long-term stability
These authors contributed equally to this work.
© Sraisth et al., Published by EDP Sciences, 2025
 This is an Open Access article distributed under the terms of the Creative Commons Attribution License (https://creativecommons.org/licenses/by/4.0), which permits unrestricted use, distribution, and reproduction in any medium, provided the original work is properly cited.
1 Introduction
Glass, polymer backsheet, and various coatings (like anti-reflection coatings) typically form the outer layers of a PV module, and those are the most vital layers in providing the proper insulation to protect solar cells from environmental stresses. In PV module manufacturing, the encapsulant is melted, and the layers are laminated together to protect the module's inner workings. This paper focuses on glass-backsheet (GB) crystalline PV module lamination due to its simpler processing compared with glass-glass modules. Another reason is that in 2020 when the study began, the market share of GB modules was 85% [1]. In 2024, almost 50% of modules are still GB modules, though this is predicted to fall to 20% by 2034 [2]. The GB crystalline module comprises the following layers, from top to bottom: glass-encapsulant-solar cells (connected using wires and ribbons)-encapsulant-polymer backsheet (see Fig. 1). The only difference to the glass-glass module is that the polymer backsheet is replaced by a glass sheet of the same or different thickness as the front glass [3].
The PV industry has shown increased interest in reducing lamination process time while maintaining the long-term stability of the module. To continue working on this idea, previous work is taken forward to achieve faster lamination processes [4]. This paper focuses only on the ethylene vinyl acetate (EVA) encapsulant. Many studies have been done on the encapsulant's crosslinking behavior during the lamination process, which is determined by crosslinking additives, of which most belong to the peroxide group of substances [5–11]. Acknowledging the importance of encapsulation and its effects on the module's chemical, mechanical, and thermal stability [12], as well as industry dynamics regarding module materials and long-term reliability, lamination topics have gained attention in recent years, especially in understanding the impact of the lamination process on several module properties [5–11].
The lamination process is one of the bottlenecks in the PV module manufacturing line, depending on the line design [4]. To balance the line throughput, an extra laminator is added, which takes up additional space in the production area, leading to extra costs on the production line. Several other methods can avoid the lamination bottleneck, such as using a bigger laminator that can process several modules simultaneously, making the laminator lengthy and heavy. Perhaps more accessible and practical would be improving the lamination process [1,4,8]. Hence, this paper aims to showcase a method to reduce the lamination process time of the GB module by modifying the design of a heating system of the laminator to a double-side heating system, with no need to increase the size of the laminator. Typical laminator machines on PV production lines employ a single-side heating system. This paper has demonstrated the positive impact of a double-side heating system on the gel content values compared to a single-side heating system. This helps to accelerate the lamination process, which is showcased and proved in this study by performing long-term stability testing, as will be explained in detail later, in accordance with IEC 61215-2 and IEC 61730-2 standards.
 |
Fig. 1 Layup of glass-backsheet (GB) solar module [Buerkle]. |
1.1 Lamination process
Solar manufacturers use several variations of the lamination process, also sometimes referred to as encapsulation. However, the principle is the same. The first step is to heat under a vacuum, removing most or all the volatile compounds and moisture (unwanted bubbles may occur if the removal of the volatile compounds and moisture is insufficient). This is done in a closed chamber in a controlled heating environment. The heat causes a softening of the encapsulants. Encapsulants also create outgases during melting, which are evacuated in the first step [7,13].
In the second step, pressure is applied to the module when its temperature reaches around 60-70 degrees. Another indication to start pressing is that the chamber has reached a low vacuum level of less than one mbar and maintained this level for a specific duration. The pressure is gradually increased to a typical range of 900-1000 mbar and maintained at this level for a specific duration, ensuring the EVA is fully cured [7]. The curing degree or gel content value of EVA is measured by several methods [12,14–16], two of them will be used in this study (see following sections). The degree of crosslinking of EVA is one of the main factors contributing to the PV module's long-term stability (and thus the overall quality of the module), mainly determined by the lamination process [17]. During this lamination step, the EVA, depending on the additive package, starts crosslinking at a temperature above 80 °C, changing from thermoplastic to a cross-linked thermoset [1]. It is specific to the EVA used and determined using the differential scanning calorimetry (DSC) method. Even though the EVA starts curing at temperatures above 80 °C, the set temperature in a process chamber varies from 140 °C to 180 °C. These temperature values are selected to accelerate the polymer's crosslinking reaction and reduce the lamination process's cycle time. The set temperature of the heating chamber is chosen depending on the type of material, process, and lamination machine. In the last step, the module is cooled from the end temperature of the second step to room temperature. This helps to stabilize the crosslinking reactions, avoid thermal degradation of the encapsulants (leading to potential undesirable changes to material properties for long-term performance [18]), and be ready for the next production step.
There are different lamination processes and parameters used depending on the module type and production line requirements. In most current commercial lamination equipment, these critical steps are distributed across three sections of the laminator. However, some systems combine evacuation and curing in one step. The reason for distributing the hot part of the process in two stages is to reduce the cycle time, as the module production lines are getting as fast as possible, going as low as 15 seconds/module cycle time.
Additionally, if talking in terms of module type, a standard glass-glass (GG) module requires a two-step lamination process [4]. ‘Two-step’ means both steps are heating stages; here, cooling is not considered part of the lamination process. It is sometimes optional or done by fan cooling during the transfer through conveyors. Due to the double glass layer, heat transfer to the inner layers is slower than for GB modules and requires more time for lamination to be completed, as recently proved and studied in detail [9]. Therefore, the two-step process is a better solution to achieve a stabilized process and faster process time for GG module lamination [4,9,19]. Meanwhile, GB modules can be laminated using a one-step or two-step process. However, for the one-step process, a heating stage is only acceptable when it achieves a faster process time; otherwise, it has no advantage over the two-step process, except that it can reduce the shrinkage effect of the backsheet while transferring from the first stage to the curing stage, and space-saving when production is only for GB module.
One way to speed up the process is to use a double-side heating system in the laminator, as explained in this paper. Different heating systems are used in the industry, and they are described in the next section.
1.2 Lamination systems
Commercially available PV laminators use different heating systems (see illustration in Figures 2 and 3). Here, the lamination system for both GB and GG modules is described because, in some cases, the system used for the GG modules can be used for GB modules and vice versa. The choice of lamination equipment depends on factors such as production capacity, module design specifications, material types, and automation level. In some cases, factories initially started with GB modules but later adopted features to produce GG modules or vice versa. This flexibility allows the lamination of different module types, which is explained below. In other cases, manufacturers initially plan to produce both module types and select an appropriate laminator.
Figure 2 describes the two-stage lamination processes, and Figure 3 describes the three-stage lamination processes. Only ‘option 3’ in Figure 2 represents the one-step process system; all other systems described in Figures 2 and 3 represent two-step process systems. The one-step and two-step processes are differentiated by performing evacuation and curing cycles combined in one press or divided into two separate presses. Important to highlight here is that ‘stage’ is related to how many stations or presses are in a lamination system. At the same time, ‘step’ is solely associated with heating steps in a lamination system (cooling is not included).
In each option, the heating can be done either by single-side heating, which means only the bottom plate is heated, or a double-side heating system, i.e., heating plate top and bottom. Cooling can be done in different ways as well. In Figure 2, ‘options 1 and 2’ have optional cooling using a fan cooling on a running conveyor. ‘Option 3’ in Figure 2 and all options in Figure 3 have a cooling system, either on one or both sides.
How pressure is applied is another notable point of differentiation between lamination systems. Pressure can be applied by a hydraulic flat press or using isobaric pressure on top of a membrane. As soon as the process is ready, pressure is applied on top of the membrane while keeping the process chamber under vacuum, where the module lies. This helps to inflate the membrane and bring it into direct contact with the module. The typical pressure used for lamination using membrane systems is in the range of 600 mbar to 1000 mbar [7].
The lamination systems also use lifting pin systems. Several pins are located on the bottom plate to lift the modules during different steps of the process, especially during evacuation. This prevents direct contact of layup with the heating plate at high temperatures to provide homogeneous convectional heat transfer. Otherwise, tempered glass with edge curl/kink and waviness will have uneven contact with the heating plate, leading to inhomogeneous heat transfer through the layup/module. The pins system can be different, typically using either a spring or a pneumatic system to control the pins. In the spring system, the pins are always up and pressed only due to pressure application. Meanwhile, pneumatically controlled pins can be pushed up and down based on the recipe or wherever required during the lamination process. Although there are benefits to the pins system, some suppliers are not implementing it.
The flat press is mainly used in stage 2 and stage 3 of the lamination system. Stage 1 is always membrane press. Except for option 3 in Figure 2, the first stage in all options in Figures 2 and 3 does the evacuation and short pressing step, enough to reach just below the temperature where the encapsulant starts curing. This stage is suitable for both GB and GG modules. The GG module can be tacked before moving to stage 2 with a low pressure of less than 500 mbar to avoid any stress on the membrane due to the glass edge. The reason for using low pressure and membrane in Stage 1 is also to prevent any edge-pinch effect on the GG module. Therefore, the flat press is beneficial for the GG lamination process [4,19]. However, ‘option 2’ in Figure 2 and ‘option 2 and 3’ in Figure 3 can be used for GG modules using a protection frame around the module to avoid any edge pinch effect. This option is the most common lamination system in the industry.
The flat press in Stage 2 cannot be used for GB modules because it will create cell cracks, and like the membrane, it cannot match the flexible form provided by the backsheet and thus creates non-uniform pressure on the module, leading to air bubbles inside the module. Therefore, in Figures 2 and 3, ‘option 1’ is unsuitable for the GB module. Since this paper aims to shorten the lamination process time of the GB module with EVA encapsulant using just one heating chamber with a double-side heating system, the lamination system in Figure 2 ‘option 3’ is selected for this research. Similarly, ‘option 1’ in Figure 3 is used only for the GG module. The other two options can be used for both GG and GB module lamination.
 |
Fig. 2 Two-stage PV module lamination processes. |
 |
Fig. 3 Three-stage PV module lamination processes. |
2 Material and methods
2.1 Experiment
The experiment was divided into two phases (see Fig. 4). The first phase aimed to determine the effect of double-side heating on the gel content values by comparing it with the single-side heating process and finding the best-suited process temperature and time for the double-side heating process. The next step was to find the detailed process parameters confirming no visual defects during lamination. Phase I was largely performed at Buerkle. In the second phase, modules were laminated using the selected final process, and the process was proved by putting the modules through long-term stability testing methods. Phase II was completely carried out at Fraunhofer ISE.
In phase I, 40 lamination process recipes were selected based on different temperatures and process times. Five different temperatures for the hot press are selected, starting from 160 °C to 180 °C, with an interval of 5 °C. In industry, the process temperature used in EVA lamination is around 150 °C ± 5 °C. High-temperature testing is conducted because most lamination processes typically operate below 155 °C, following encapsulant suppliers' recommendations. Some suppliers specify a maximum processing temperature to ensure optimal crosslinking and material stability. However, certain encapsulant materials, like those designed for faster curing, allow processing at higher temperatures.
There is insufficient research to prove that high-temperature usage in the lamination process is reliable in the long term. Moreover, it is known that EVA degrades at high temperatures, producing acetic acid, which is detrimental to the reliability of PV modules [20,21]. Temperatures around 150 °C are proven in the industry, and some promising results, where higher temperatures have helped achieve a faster lamination process, have given more reason to do trials at higher temperatures [4,8]. This study also aims to find the upper limit for process temperature. In terms of time, the process time is selected from 2 to 9 min, with an interval of one minute. Each recipe included constant parameters such as pressure ramp-up time, vacuum level, and cooling rate, along with linearly distributed variables like evacuation time, curing time, and pressure hold duration to optimize the lamination process.
Using all 40 selected recipes, gel content samples were prepared to measure the encapsulated material's crosslinking value. Five samples were prepared for each process, numbered A, B, C, D, and E, and placed in five different locations on the modules, as described in Figure 6 in Section 2.3. This process was repeated for both heating systems, single-side and double-side heating.
In total, 200 samples were prepared and measured for the degree of crosslinking using (DSC) for the single-side heating system. The same was repeated for the double-side heating system. The DSC method was selected for crosslinking measurement because it provides relevant and reliable measurement data with a favorable effort-gain ratio, even if additional resources are required. Moreover, this method does not involve chemical solvents, making it a cleaner and more sustainable option. These samples were later transferred to Fraunhofer ISE for gel content determination. Only 80 samples were selected for chemical Soxhlet gel content measurement, two per process. The sample count was reduced from five to two per process based on the observed narrowing distribution of similar results while considering the long measurement cycle and significant chemical consumption associated with the Soxhlet method. Soxhlet gel content measurement is performed because it is the main method, according to the IEC 62788-1-6 standard, to determine gel content, which is usually used for referencing other crosslinking testing methods (like DSC), and it is widely adopted in module manufacturing facilities.
The adhesion test is also a good criterion for checking process quality. Adhesion can be measured between glass and encapsulant and between backsheet and encapsulant. However, this has been addressed in parallel research and is not covered here. There, it shows that with the increase in temperature, the peel strength at the glass/encapsulant interface increases, even at high temperatures of 180 °C with short processes [10].
The next step is to choose the recipe, laminate full-size modules to improve the recipe, and check the repeatability. Based on the above results, the best-suited temperature and time are selected. Seven modules were laminated with two different process times of 6 and 5 min to validate the recipe from optical quality criteria, which will be described later. The process time is the total lamination time, excluding non-value-added operations like module transfers and press opening-closing. Based on the above-combined results, one final recipe was selected to laminate the modules for long-term stability testing.
In phase II, using the final recipe, eight full-size GB PV modules were prepared at Fraunhofer ISE using industrially available raw materials, encapsulant, and backsheet, the same as used for gel content sample preparation, and the same lamination system as used in phase I. Later, these eight modules were selected for different long-term tests. All the materials and methods used are described in the following section.
 |
Fig. 4 Description of the complete experiment in two phases. |
 |
Fig. 5 Lab Laminator used for gel content sample preparation and process optimization at Buerkle. |
 |
Fig. 6 Gel content sample preparation layup (left) and five different locations per lamination process (right). |
2.2 Machine (Laminator)
Buerkle's lab laminator (YPSATOR 1222-6 HKC + HKF) was used for gel content sample preparation and module lamination (see Fig. 5). The gel content samples and initial modules for process evaluation were prepared and laminated at the Buerkle factory. The full-size modules were laminated on a similar lab machine from Buerkle installed at Fraunhofer ISE.
Both laminators are multi-stack laminators with different process chambers in the same machine. According to the process chosen, only levels with Hot-Vacuum (HV) and Cold Press (CP) were used. HV has a double-side heating system using two heating plates, top and bottom, and the pressure is applied using a membrane. Top heating plates do not come in direct contact with the module. Both heating plates can be heated separately. For a single-side heating system, the upper plate is switched off, and only the bottom is kept on during the trials. Conversely, both top and bottom heating plates were switched on in the double-side heating trials. The bottom plate also has a lifting pin system to lift the modules during the process when needed, and it is pneumatically controlled. HV level can do evacuation and curing cycles in one step (see Sect. 1.2 for additional details). The heating plate is 2.2 m × 1.2 m.
In the CP, the module is cooled down using a double-side cooling system with cold water running through cooling plates. The temperature can be controlled according to requirements. The machine has an automatic loading and unloading system. This helps to replicate the actual module production cycle time without interruptions. The only difference to the industrial machines is that this lab laminator can accommodate only one full-size 60-cell module at a time instead of 7–16 modules, depending on the size of the laminators.
2.3 Materials (gel content samples, module)
A specific set of glass, solar cells, EVA encapsulants, backsheet, and other required materials were selected for the tests. The machine and methods used for evaluation are chosen according to industry standards; see the following sections. The materials used for the gel content sample and module preparation are described in Table 1.
The same encapsulant type was used for gel content samples because the experiment aimed to understand the heating system's effect on crosslinking rather than studying its impact on different encapsulant types. The gel content samples were prepared by running the two pieces of encapsulant (100 mm × 100 mm) through the full lamination cycle. The same glass carrier was used for all the process runs. The two layers of encapsulants were placed between the Teflon sheets, which helped in easily removing the gel content samples from the module and utilizing the same glass for the whole experiment. No cells were placed between the encapsulants during sample preparation. The same was followed for all five positions on the glass. The layup for gel content sample preparation is shown in Figure 6.
Raw materials for the GB module and gel content sample preparation.
2.4 DSC method
The DSC method was used to measure the crosslinking of the gel content samples. DSC gives an indication of the crosslinking degree based on the exothermic enthalpy of the crosslinking reaction given by peroxide decomposition. It is faster than the Soxhlet process and is reliable for assessing the lamination process. The method measures the thermal transition of polymers used in the encapsulant, including melting, evaporation, glass transition, and exothermic or endothermic reactions [22]. The measurement was done at Buerkle on the DSC 200 F3 machine from Netzsch GmbH & Co. Holding KG. The laminated samples were stored in a zip-lock plastic bag at room temperature in a dark, dry place. The samples were tested for DSC measurements immediately after finishing the lamination process. A circular sample of 5 mm diameter was cut out from the gel content sample, weighted, and placed in the crucible. The measurement setting is 20 °C to 200 °C at a constant heating rate of 10 °C/min. The process was repeated for both cured and uncured samples. The DSC value or the degree of crosslinking of the cured sample is calculated by dividing the reaction enthalpy from an exothermic peak on the heat flow plot in the software of the cured sample to the uncured sample [23]. After the DSC test, the samples were placed again in the same Ziplock bag, and all the samples were stored at room temperature in a dark, dry place. They were stored for a maximum of one month at Buerkle before providing to Fraunhofer ISE.
2.5 Soxhlet extraction
The Soxhlet extraction test is a popular yet time-consuming method for evaluating the lamination process of PV modules. Soxhlet is a more direct measurement for measuring gel content because it measures the fraction of encapsulant that is not soluble with the solvent used. It is used primarily while developing lamination processes for new BOMs [8,14]. It is conducted by cutting the laminate into small pieces, placing them in a stainless-steel mesh tube, and measuring the total weight [9]. The samples in the study were 1 cm x 1 cm, and the total weight of the samples put in the mesh tubes was 0.5 g. Afterward, it is extracted in a solvent, xylene, in this case, for 8 hours at 20 cycles per hour. No antioxidants were used in the process [16]. After the extraction period, the sample is dried for 14 hours in a vacuum oven at 100 °C. Finally, the dry sample is weighed again. These data are used to calculate the gel content by the following formula [24]:
 (1)
(1)
Here, “M0” stands for the weight of the empty mesh tube, M1 defines the total weight of the sample and the tube before the extraction, and M2 is the total weight after the extraction and drying process. As mentioned, 40 different lamination processes were analyzed in this study by extracting two samples of each process for both heating systems. The extractions were conducted using the Behrotest apparatus based on the IEC 62788-1-6 standards (see Fig. 7).
2.6 Temperature measurement
Another method to confirm the lamination process is measuring the module's temperature with respect to time. Taking measurements from inside the module gives us a precise understanding of the temperature. It can also be used to confirm the temperature uniformity across the module and to verify any offset between the set temperature and the actual temperature in the module in a laminator. The measurement was done using thermocouples inside the module. Six thermocouples were used, four on the corners and two in the center of the module. The image in Figure 8 shows the sample used for lamination. Figure 8 also illustrates the layup and location of the sensors.
The thermocouples were placed between the two encapsulants, and no cells were used for the layup. The cells were not used because it was not part of the scope. The aim was to understand the temperature profile inside the module for different processes and the failures that occurred during lamination trials. The temperature homogeneity across the module is also discussed briefly in this study. However, the temperature difference below and above the cells is not within the scope of this study. It has been investigated and covered in a different study [9]. The study revealed that temperature inhomogeneities can arise between the front and rear sides of the cells during the initial stages of the lamination process. These variations may result in differing gel contents at these locations. Thus, optimizing the process time to achieve a uniform temperature profile throughout the module is critical, ensuring homogeneity in both temperature distribution and gel content.
Table 2 shows the materials used and the device used for the measurement. The measurement is crafted in a way that follows the actual process without interruptions during module transfer from one stage to another without any thermocouple damage.
 |
Fig. 8 Temperature measurement module sample with six thermocouples (left) and layup (right). |
Materials and devices used for temperature measurement.
2.7 Glass-backsheet lamination process (one-step process)
As explained in Section 1.2, a one-step process is selected for the GB module lamination based on the short lamination process developed by Buerkle [4,26]. The recipe was chosen based on gel content value and optical quality criteria, explained in results, Sections 3.1 and 3.2. The chosen recipe is confirmed with a temperature measurement test, described in Section 3.3.
The final recipe is developed from the perspective of industrial applications. This means the process should be fast and require no significant fine-tuning when transferring from the lab to the production machine. As explained in Section 1.2, the process had two stages: one hot press (set temperature 170 °C) and the second stage cooling press (set temperature 25 °C). The process time chosen was 5 min—the same process time for each stage.
The process time excludes any non-value-added time. The heating process in the HV press, including evacuation and pressing (curing), is performed within five minutes. The vacuum level in the process chamber reached values below one mbar, and the pressure value used during the pressing phase (curing) is 1450 mbar, the maximum pressure the machine can achieve. The reason for overpressure, pressure above the atmospheric value of 1000 mbar, is to help achieve faster lamination [4].
After the hot press, the module is transferred to the cooling press for the same process time to follow the production line throughput balancing. The module is cooled down using a double-side cooling system at 25 °C and low pressure. A low pressure of <250 mbar is enough to cool the module without creating micro cracks.
2.8 Long-term stability testing method
To validate a faster lamination process, one of the tested optimized processes was selected based on optical quality, with a 5-minute duration, 170 °C set temperature, and double-side heating. Eight full-size PV modules were laminated and subjected to reliability and safety testing according to certification standards, as shown in Table 3, where each aging test is described. Moreover, before and after applying the stress tests on each PV module, several characterization measurements were carried out to monitor the degradation in performance or safety. All modules were subjected to a 20 kWh/m2 initial light soaking for stabilization. The performance measurement after this serves as a stabilized initial measurement.
Summary of number of PV modules subjected to different aging tests.
2.8.1 Characterization and aging tests
Dry insulation test (IEC 61730-2, MST 16)
The insulation between current-carrying parts and the frame or the ambient was determined. In the case of frameless modules, an artificial frame was constructed by wrapping a conductive foil around the edges of the sample. The dry insulation test is a high-voltage test that determines the insulation resistance in a dry environment. During the high voltage test, 2000 V + four times the maximum system voltage was applied for 1 min. During this time, no dielectric breakdown or surface tracking should occur. For the insulation measurement, the maximum system voltage is applied between the cell matrix and frame for 2 min. After this time, the insulation resistance is found. The product of insulation resistance and module area must not be below 40 MΩ*m2.
Wet leakage current test (IEC 61215-2, MQT 15)
The wet leakage current test is a measurement of insulation while the module is immersed in water. Non-framed samples were prepared by applying adhesive aluminium tape around the module edges as a simulated frame. During the test, the maximum system voltage was applied for 2 min. After this time, the insulation resistance was determined. The product of insulation resistance and module area must not be below 40 MΩ*m2.
Electroluminescence (EL) imaging
Inactive areas, cell cracks, and other electrical failures are easily detected in EL because these will appear dark in the EL image [27–29]. EL images of modules were taken using a measurement system of type “EL-lab LEL” by MBJ Solutions while applying Isc and 0.1 Isc to the module and detecting the radiation it emits. The PV modules were measured before and after accelerated aging tests from the front (glass) side.
Performance tests
The I–V curve essentially provides key parameters about the module performance. The measurement conditions include providing the modules with pulsed artificial light from a class AAA solar simulator with an Xe lamp under STC (1000 W/m2, 25 °C, AM 1.5) [30]. Before testing, the PV module was stored at (25 ±3) °C and (50 ±30) % relative humidity for at least 10 hours. The measurement uncertainty (PMPP) was 2%.
Thermal cycling test (IEC 61215-2, MQT 11)
In this test, the ability of the module to withstand thermal stress caused by repeated changes in temperature was determined. The test was conducted following the requirements of IEC 61215-2 MQT 11 [30]. The test conditions are as follows: 200 thermal cycles from −40 °C to +85 °C with a halt at each extreme of at least 10 min. The internal circuit of the module was monitored during the test procedure to detect any open-circuit or short-circuit fault that may occur during exposure. In this regard, the current of IMPP was applied during the ramp-up from −40 °C to +80 °C, while a current of 100 mA was applied for the rest of the time. In this study, the thermal cycling test is repeated four times on modules M08 and M09 to achieve 800 thermal cycles.
Damp heat test (IEC 61215-2, MQT 13)
The damp-heat aging test (DH) was conducted according to IEC 61215-2 (MQT 13) [30]. The test conditions are 85% relative humidity (RH) at 85 °C. The PV modules were subjected to indoor accelerated aging tests under the DH tests in time intervals of 1000 h up to 3000 h.
Mechanical load test (IEC 61215-2, MQT 16)
In this test, the ability of the module to withstand static wind, snow, or ice loads was determined. Therefore, a cyclic load, three cycles of ±2400 Pa − alternating pressure and suction, was applied on the module front and rear sides. On one of the modules, a damp-heat test with 1000h followed by a mechanical load test (ML) was carried out (see Fig. 9, left). This procedure was used to identify specific weak points in a module. The record of the applied load and the measured deflection are given in Figure 9 (right).
 |
Fig. 9 Mechanical load test on the module (left), applied load in Pa, and measured deflection in mm (right). |
2.8.2 Safety tests (Sequence B and B1, IEC 61730-2)
Sequence B and B1 are essential components of the rigorous testing protocols PV modules undergo to ensure they are safe, reliable, and durable under various environmental conditions, as explained in Figure 10. These tests help ensure that PV modules maintain their performance and structural integrity under harsh environmental conditions, which is crucial for long-term reliability.
UV test
The UV test was conducted as part of sequence B according to IEC 61730-2 (MST 54) [30]. The test conditions are performed with fluorescence tubes at 60 °C. The spectral irradiance of the fluorescence tubes used for the UV aging test is shown in Figure 11 [31]. According to the safety test standard, the exposure dose of 60 kWh/m2 was used. The temperature was measured behind the modules with a PT100 temperature sensor. The temperature was found to be 60 °C on average. The module was subjected to indoor accelerated aging tests under the UV tests as part of sequence B.
Humidity freeze test (IEC 61215-2, MQT12)
In this test, the ability of the module to withstand the effects of high temperature and humidity followed by sub-zero temperatures was determined. The test was performed in the context of sequences B and B1 (IEC 61730-2). It involves ten thermal cycles from −40 °C to +85 °C, with a halt at +85 °C for at least 20 h and a halt at −40 °C for at least 30 min. A relative humidity of 85% was applied to temperatures of 85 °C.
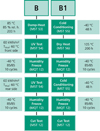 |
Fig. 10 Description of Sequence B and B1 (IEC 61730-2). |
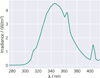 |
Fig. 11 UV chamber TLPV, spectral distribution. |
3 Results and discussion
3.1 DSC crosslinking and Soxhlet gel content results
The following Figures 12 and 13 show the DSC crosslinking results for the different set temperatures for all the tested samples, for the single-side heating system and the double-side heating system, respectively. The crosslinking values are distributed across the process times and are grouped according to the set temperature. The process times, from 2 min to 9 min, are differentiated by the combination of the light-to-dark intensity of the chosen group color and the markers. For example, for 175 °C, the 2 min curve is light red, and 9 min is dark red. Each curve shows five values measured for different locations (A, B, C, D, and E) on the modules (see Fig. 6 for reference).
In Figure 12, for the single-side heating system, the values for different process times for all set temperatures are more or less linearly distributed across the y-axis scale until concentrating for processes with high temperatures ≥175 °C and longer process time ≥7 min. The values start from as low as nearly 0% for 160 °C at 2 min up to roughly 75% at 9 min process time. This distribution of values is getting smaller with the increase in temperature. For 180 °C, it varies between 34% to 91% crosslinking value, a difference of only 57%. A similar trend is witnessed for double-side heating (see Fig. 13), with crosslinking values distributed over a wider range for low temperatures than higher temperatures, except the values are not linearly distributed across the y-axis scale for different process times. They are concentrated above 75% crosslinking value. Interestingly, the crosslinking values with a double-side heating system are distributed much wider across the scale than the single-side heating system.
For 160 °C, it varies from 8% at 2 min to 93% at 9 min process time, i.e., 85% difference. Whereas for 180 °C, it is reduced to only 68% difference, wider than the single-side range. This wide range is just because of low DSC crosslinking values at shorter process times, especially for 2-minute processes, where there is no detectable conversion of peroxides, as shown by gel content values in Figures 16 and 17. Excluding 2 min process time, this range is narrowed down to 20% for 180 °C with a double-side heating system. The values for longer process times ≥5 min at high set temperatures ≥170 °C overlap, so it is difficult to differentiate the values for different process times. The average values of each process are explained in the following figures for clear differentiation between various processes. Overall, this distribution clearly shows the impact of a double-side heating system on the crosslinking. They are reaching high crosslinking values, more than 75–80%, within a short process time, as low as 3–4 min.
Figures 12 and 13 also show the distribution of values across the module. The values follow different trends for each process. For example, the C value in the module's center does not always have higher values than other positions. However, some curves look identical irrespective of time and temperature. As shown in Figure 12, the 5-minute curve at 160 °C looks similar to the 2-minute curve at 165 °C. Also, the 8-minute curve at 170 °C looks identical to the 6-minute curve at 180 °C. In Figure 13, identical curves are also visible. Most prominent are all the 3-minute curves at different temperatures except 175 °C. This might be related to the uneven distribution of additives across the encapsulant film, which is the subject of further investigation.
The DSC crosslinking values at different positions in the module also vary based on the heating system. For single-side heating processes (see Fig. 12), the maximum crosslinking difference across the module for shorter processes ≤6 min is higher than for longer processes. The highest deviation of 12.1% between all positions is measured for the 2 min process at 170 °C and the lowest for 7 min at 170 °C, just 0.7%. Overall, out of 40, only five values reach less than a 2% maximum deviation between the A and E positions for all single-side heating processes. This shows that with the single-side heating system, you need longer processes to have uniform crosslinking across the module. Some deviations can be due to the distribution of peroxides.
Meanwhile, 14 processes with the double-side heating system have a maximum crosslinking deviation across the module of less than 2%, and 21 processes with less than 3% deviation. This already shows that changing the double-side heating system can reduce the deviation in crosslinking values across the module. However, one interesting difference between single-side heating systems is that the shorter processes with double-side heating systems have much higher deviation across the module. For example, in Figure 13, for 2 min at 160 °C, the maximum difference is 16.8%, and for 165 °C at 2 min is 13.3%. Excluding 160 °C set temperature processes in Figure 13, all other temperatures with 5 min or longer processes all show a maximum deviation of less than 3.5%. For 165 °C processes, the lowest crosslinking deviation of 1.1% across the module is measured at 6 min process; for 170 °C, 0.7% at 7 min; for 175 °C, 1.0% at 6 min; and for 180 °C, 0.89% at 7 min.
Most industrial PV module lamination processes are longer than 7 minutes and mainly involve two-step heating. Processes 4 min or shorter do not show sufficient crosslinking uniformity across the module. Therefore, only 5- and 6-minute processes seem to be suitable. The latter has better uniformity due to a one-minute longer process. For 6-minute processes, the deviation varies between 1.0% (175 °C) and 2.0% (170 °C), and for 5-minute processes, it varies between 1.6% (180 °C) and 3.5% (170 °C).
Figures 14 to 16 explain the average crosslinking values for all the processes using both heating systems. Both DSC and Soxhlet measurement values are compared. DSC crosslinking values are shown in dash lines, and Soxhlet gel content values are shown in solid lines. Figure 14 shows the average crosslinking values determined by DSC for single-side and double-side heating processes. The difference in the single-side and double-side curves is that the former is shown with short dashes and the latter with longer dashes. The different times and temperatures for the lamination process result in various degrees of crosslinking. The correlation between the lamination process and the curing of encapsulants has already been studied in detail [11,12].
The results show that EVA has a different crosslinking rate when it goes through a different heating system. For example, in Figure 14, by using the 3 min process at 180 °C with double side heating, the encapsulant already reached a crosslinking value of more than 80%. In encapsulant datasheets, the gel content value is recommended to be ≥75% for a good lamination process. Similarly, the recommended range given by one encapsulation material manufacturer is 75% to 90% [32]. Another study [5] suggests an optimum gel content range of 84% − 90% based on lamination conditions. However, for the process selection in this study, an 80% or more gel content value target was selected [14]. Another reason is that it is decided to target a higher value than the lowest recommended gel content value. The single-side heating process at 180 °C needs at least 6 min process time to achieve the same target value. This is just one example where the process time can be reduced by half by changing the heating system.
It is interesting to note that for processes, process times 6 min and higher, with double-side heating and temperatures above 170 °C, the degree of crosslinking reached saturation, around 94-95%. Whereas for the single-side heating system, the crosslinking value continuously increases regardless of time and temperature. This shows that a lamination process of 6 min or shorter is possible. However, such a short and quick process must fulfill a long-term stability test, and the module must pass visual and optical inspections. These results were further proved by Soxhlet gel content results, which were found as a testing method in the industrial environment with broader implementation than DSC.
All samples were measured for Soxhlet gel content to compare with the DSC crosslinking results. Figures 15 and 16 compare the average values of DSC and Soxhlet for single-side and double-side heating systems, respectively.
Figure 15 shows a significant difference in the gel content values of the single-side heating system for shorter process times of 5 min and below. DSC values showing partial conversion of peroxides for short lamination times do not necessarily mean a high crosslinking degree is achieved, which the Soxhlet measurement values prove. The relationship between the two values has been studied in detail [4,12]. The gel content always shows lower values than DSC for a shorter process time < 5 min. After 5 min or more, the gel content values jump higher than DSC values, eventually reaching the same level or ending lower than DSC values for a process time longer than 10 minutes. A similar trend is seen in this study. The gel content and DSC crosslinking values are identical for processes ≥170 °C with a process time of 6 min and above. The gel content values also show that a single-side heating system either requires a long process time of ≥7 min or high temperatures of ≥175 °C to reach a good gel content value above 75%.
In Figure 16, the gel content values have already reached the recommended value of around 75% or more at a process time of 4 min, irrespective of the set temperature. Thus, a higher degree of crosslinking can be achieved using the double-side heating process, specifically for short lamination processes. This last aspect is attributed to the faster heat transfer provided from both sides. Meanwhile, the gel content values compared to DSC values for the double-side heating system also follow a similar behavior as seen in Figure 15 for single-side heating. Except for the 6 min process at 160 °C, all the Soxhlet gel content values for ≥6 min, regardless of the set temperature, show values in the same 84-87% range, reaching saturation.
Finally, the Soxhlet gel content results of single-side and double-side heating system lamination processes are compared, as shown in Figures 15 (right) and 16 (right). Referring to the target gel content value of 80%, for the single-side heating process, only higher set temperatures of 175 °C and 180 °C for process time above 6 min have fulfilled the target. The 170 °C set temperature process requires almost 8 min to reach more than 80% gel content. Meanwhile, the lower temperature process managed to achieve it at 9 min process time. For one of the single-side heating processes, it takes at least 5 minutes at 160°C to get a gel content value >0%. The higher the temperature, the lower this value. In the case of a double-side heating process, it takes only 3 minutes at 160°C to get a gel content value of >0%. Double-side heating processes clearly show the potential to reduce process time. So, for processes from 5 minutes and above, all temperatures show gel content values more than or near the 80% mark. All other temperatures above 165 °C crossed the set target of gel content value for a 4-minute process, except at low temperatures of 160 °C and 165 °C. Although not that low compared to industry standards, these two low temperatures show only a gel content value above 70%.
Choosing a shorter process time with enough evacuation and curing time is essential for a good lamination process. Therefore, based on the results, including the crosslinking uniformity across the module, it was decided to focus on trials of a 6-minute lamination process at 170 °C.
 |
Fig. 12 DSC degree of crosslinking of the single-side heating lamination process for different temperatures and process times at five different positions on the module. |
 |
Fig. 13 DSC degree of crosslinking of the double-side heating lamination process for different temperatures and process times at five different positions on the module. |
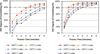 |
Fig. 14 Comparison between the degree of crosslinking values of single-side (left) and double-side heating (right) lamination process over different temperature and time processes. |
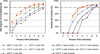 |
Fig. 15 Comparison between the DSC degree of crosslinking (left) and Soxhlet gel content values (right) of the single-side heating lamination process. |
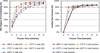 |
Fig. 16 Comparison between the DSC degree of crosslinking (left) and Soxhlet gel content values (right) of the double-side heating lamination process. |
3.2 Visual results during process optimization
The next step was to laminate modules with the 6 min process at 170 °C set temperature with a double-side heating system. This step aims to find the right process parameters by doing module lamination. The right process parameters mean identifying the adequate evacuation time, ramp-up time for applied pressure, time to apply pressure, and curing time for a defect-free process. The idea was to evaluate the recipe only from an optical quality point of view. Therefore, the string-connected ribbons were not soldered with the cell strings' busbar ribbons, the former was just laid upon the latter (see Fig. 17).
The modules were examined based on seven quality categories regarding bubbles between the cells & strings, bubbles at the interconnection area, string movement, backsheet optic, and cell breakage (visible to the naked eye).
The first process is tested with aggressive parameters (early short-duration pressure application on the module during the evacuation phase) to reach high temperatures where EVA starts curing as quickly as possible, followed by the pressing step. It passed all quality criteria except the backsheet optic. The module's rear surface appearance was poor, with several bumps and wrinkles on the backsheet (see Fig. 18, top). The wrong pressure timing could have triggered this. The effect of pressure timing on the module temperature was investigated later with the temperature measurement inside the module during the lamination cycle (see Sect. 3.3). So, in the following runs, different parameters were tested to improve the backsheet optic, and from the fourth recipe onwards, the backsheet showed improvements with fewer bumps and wrinkles. However, the module still did not have a plain and smooth surface. Based on the first five trials, it was evaluated that a few settings in the process might have already created a high temperature at the beginning of the lamination cycle. Considering this assumption, a new recipe was designed and tested, producing a defect-free process with a good backsheet optic, having a smooth surface without any wrinkles and bumps (see Fig. 18, bottom). Details of the process steps are not shared here. There was no issue with bubbles inside the modules, thanks to the experience with lamination parameters. The same was expected for the rear-side backsheet appearance, but the aggressive process parameters were unsuitable for the optical appearance of the backsheet.
After optimizing a 6-minute process, the question was whether to test this recipe for long-term stability or to go further with a shorter process time. For a 5-minute process at 170 °C, the gel content value was 85% (see Fig. 16, right), and crosslinking values were also homogeneous across the module with a maximum deviation of 3.5% (see Fig. 13). Therefore, it was decided to test a 5-minute process with similar lamination parameters. Positively, lamination #7, with 5 min process time, also passed the optical quality criteria with good backsheet visual quality. In the end, several modules were laminated with the same recipe #7 to check the repeatability of the process. All passed with no optical defects. Table 4 shows the optical quality of the tested recipes. Finally, recipe #7 is selected for the next phase, long-term stability testing.
The grading system used was as follows:
Backsheet Optic: 1 = bumps and wrinkles, 5 = few bumps, 10 = plain and smooth surface;
Bubbles: 1 = more than 5 bubbles, 5 = 3 bubbles, 10 = no bubbles;
String Movement: 1 = when strings moved more than 2 mm, 5 = >1 mm, 10 = <1 mm;
Backsheet Shrinkage (whether the backsheet has shrunk and created delamination at the edges): 1 = delamination, 10 = no delamination;
Cell breakage: 1= breakage, 10 = no breakage.
 |
Fig. 17 60 cells GB PERC module laminated for process optimization, front side (left) and rear side (right). |
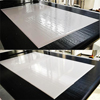 |
Fig. 18 GB PV module with poor backsheet optic (top) and good backsheet optic (bottom). |
Optical quality results of the seven laminated modules tested at 170 °C.
3.3 Temperature measurement results
Temperature measurements were performed for the above-tested processes to understand the backsheet defects and the temperature profile in the module during the lamination process. For each temperature measurement, six thermocouples were used at six distinct locations inside the module (see Fig. 8 for reference). Using multiple measuring points, this method is followed to prove the temperature uniformity across the module. Since temperature uniformity is not part of the scope of this paper, the module's temperature uniformity for recipe #7 (5 min process at 170 °C set temperature) is briefly described (see Fig. 19).
For industrial purposes, it is important to prove the temperature uniformity of the heating plate because one of the acceptance tests of the laminator is to test the quality and performance of the heating plate, which is one of the main components of the laminator.
In Figure 19, the line chart shows the temperature curves of all six thermocouples for the lamination cycle. The module temperature starts at room temperature, ∼29 °C, and ends at a temperature achieved at the end of the cycle, ∼26 °C. All curves have followed the same trend, but exact uniformity can be judged by the differences in the temperature values of six points. In this cycle, the maximum temperature difference between all thermocouples at the end of the heating step (end of curing also) was 2.2 °C. The temperature gap gradually reduces from 3.2 °C to 2.2 °C in the last 1 minute. At the end of cooling, it was 1.8 °C.
The graph also includes module transfer to hot press, press closing, releasing pressure, press opening, module transfer to cold press, press closing, cooling press opening, and finally, module transfer to the unloading belt. There were no interruptions from handling thermocouples and the Datapaq measuring instrument. It was a continuous process, and values showed good uniformity inside the module. Typically, temperature uniformity of the heating plate is considered good when the different measuring points give values within ±2 °C of the set temperature. Here, the module end temperature in the hot press (166.2 °C) does not reach the set temperature (170 °C) because of the short lamination process. Therefore, it cannot be judged based on the heating plate's set temperature tolerance limits. Thus, it can be considered a good process if values are within ±2 °C tolerance of the mean value of all points at a particular time. At the end of the heating step of the 5-minute process (at 6 min 20 seconds in the graph), the temperature values were within the ±2 °C tolerance (+0.96 °C, −1.24 °C), where the mean value was 163.36 °C.
In this trial, similar to the visual quality test, the measurement starts with a 6-minute process and then moves to a 5-minute process. All temperature measurements were done at a set temperature of 170 °C. The chart displays the total lamination process, including module transfer in and out of the process, heating press, and cooling press. Thus, the time in the chart is more than 13 and 12 minutes, including transfers, for 6 min and 5 min process time, respectively.
Recipes #1 and #2 have backsheet optics similar to those of #3 and #5. Therefore, it was decided to do the measurement only for recipes from #3 to #7. The temperature measurement is shown in Figure 20.
The first temperature measurement was done for process #3 with the worst backsheet optic (uneven surface with bigger bumps and more wrinkles than other modules across the backsheet), and it was found that the module temperature during the evacuation cycle was approximately 100 °C before the pressure was applied, see blue curve in Figure 20. This is probably too hot for a backsheet under a relaxed state during the evacuation phase, with no pressure applied on the module. The PET-based backsheet attains a glass transition temperature (70–100 °C), shrinks in the machine direction (MD), and expands in the transverse direction (TD) [33]. According to the study by Romer et al., PET is expected to be relaxed under the lamination process instead of shrinking or negative coefficient of thermal expansion (CTE) [33], which may have simulated pressure application on the module during the glass transition of PET. However, in recipe #3, there is no pressure on the module in the glass transition, and the backsheet behaves anisotropic, leading to shrinkage in MD and expansion in TD, and probably shrinking again at high temperatures, according to the datasheet's heat shrinkage value at 150 °C. Thus, the backsheet optic in the laminated module was not smooth and showed bumps and wrinkles. The recipes and their influence on the backsheet were not part of the scope of this study, and they can be investigated separately in detail.
In the following two trials, the pressure application point dropped below 90 °C, in the 80–86 °C range. This correlates to the quality of the backsheet optic. Recipe #6 was optically good, and when temperature measurement was done, it was found that the pressure was applied when the module temperature reached just above 60 °C, below the glass-transition region. This is a significant difference of 40 °C between the optically bad module and the good module from the rear side appearance.
The parameters used for recipe #6 proved safer and more stable. Thus, similar parameters were used to measure module temperature for a 5-minute process. It follows the same trend as the 6-minute process, except it is cut short by one minute, as shown in Figure 20. The module reached the end temperature of 165 °C at the end of the 5-minute lamination process. For the 6-minute process, the module reached the same temperature as the set temperature of the heating plate, i.e., 170 °C. This data also informs about the time a process takes to achieve a set temperature inside the module for a particular temperature setting using a double-side heating system. The time taken to each set temperature inside the model will differ for different set temperatures, which can be further investigated in detail.
Based on the above results, the final recipe #7 with a 5-minute process time at 170 °C is selected and transferred to the team at Fraunhofer ISE to proceed with the final lamination.
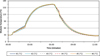 |
Fig. 19 Lamination temperature profile of six different locations inside the module for the 5 min process at 170 °C using a double-side heating system. |
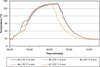 |
Fig. 20 Lamination temperature profile of five different processes inside the module at 170 °C using a double-side heating system. |
3.4 Characterization after lamination
At Fraunhofer ISE, eight modules were laminated using the selected process, and all were checked for optical defects. No such visual defects were seen during the module production. Seven modules were sent for the long-term reliability tests, and one module, M20, was held as a reference and backup. The modules were numbered M18 to M25 (see Tab. 3). Before carrying out the stress tests, all modules were tested for electrical insulation under dry and wet conditions (IEC 61730-2). All modules passed the tests at the initial state.
3.5 Characterization after reliability testing
Modules were continuously checked for any visual defects during the long-term stability tests, where a visual inspection was carried out before and after each stress test. M21 and M23 showed backsheet delamination after DH aging for 3000h (see Fig. 21), which was not seen in the previous aging steps. In the case of M21, the backsheet was cracked, which can be a sign of embrittlement of the material. Cracks in the backsheet, especially when close to the module frame, can be critical for the safety and insulation properties of the module [34]. This failure in the module might have happened for several reasons: backsheet quality, manual handling/framing of the module, or the lamination process itself because of the high pressure. This failure was not part of the scope of this study. Except for these two, no modules showed visual abnormality.
The EL images (see Fig. 22) confirm the earlier observation. From the EL images, it is visible that there are more electrical faults along the ribbons of the cells only after the last DH step reaches 3000h. These are typical features of corrosion that can be triggered by moisture ingress, followed by acetic acid formation, which could originate from moisture diffusion through the backsheet. Additionally, the process of moisture ingress can also be facilitated by the backsheet cracking, as shown earlier.
Electrical insulation under dry and wet conditions was also passed after these individual stresses and the complete sequences. The measured performance data before and after each stress test for all modules, except M20, are presented in Figure 23. Deviations of the intermediate and final measurements from the initial measurement are given in Figure 23.
In the chart, the dark blue color bar is for M19 (TC tests) and M23 (DH tests), and the light blue color is for the rest of the modules mentioned in Table 3. The modules passed the performance criteria of less than 5% power loss (PMPP) degradation after damp heat (1000h), thermal cycling (200 cycles), and mechanical load tests (see Fig. 23, left). The test duration was consequently extended beyond the standard requirements to TC 800 and DH 3000h (3- and 4-times IEC standards, respectively).
It is essential to note that the standard test sequences, according to IEC 61215-2, 200 cycles TC tests, 1000h DH tests, and 1000h DH followed by mechanical load tests, do not incur an unusual performance degradation of the tested modules. Afterward, those modules showed minor degradation after the extended thermal cycling tests up to 800 cycles, where the output power relative to the initial value showed a deviation of less than −2%, which demonstrates that the thermomechanical stability of the modules, among other properties, can be ensured by the optimized lamination process.
However, PMPP shows stronger degradation of up to −8.4% after 3000h of extended DH exposure (see Fig. 23, right). The power loss after DH 2000h amounts to −1.5% (M21)/–2.5% (M23) and drastically worsens after the third aging step, mainly due to a decrease in fill factor (FF). These results correlate well with the EL images compared for the module before and after the last aging step.
The last two Modules, M24 and M25, are also tested for the test sequences B and B1. For these test sequences (B and B1) from the IEC standard, pass/fail criteria exist, but they are not related to power loss. Instead, they focus on visual inspection and insulation safety. A degradation of less than −3% in PMPP for both sequences can be evaluated as a hint of good reliability, which is visible in Figure 23 (right).
Even though the faster lamination process has passed the IEC 61215-2 standard, two times the IEC standard for DH exposure and four times the IEC standard for TC tests, two modules failed to withstand the 3000h DH test. Wrinkles on the backsheet followed by backsheet cracking took place after 3000h DH tests, where the correlation between the defective backsheet and electrical faults along the ribbons detected by EL image on the same module was observed. This distribution of the electrical faults of the ribbon led to a significant deviation in the power output in reference to the initial value. This finding provides evidence that backsheet failure could be considered one of the critical degradation modes related to module performance. And this backsheet failure could have happened for several reasons. The investigation of this failure was not within the scope of this study, but it can be investigated in a separate experiment setup to determine the root cause of defects and improve the lamination process. The reasons for failure could be due to backsheet quality (thickness not enough, lamination of PPE layers is not enough for the high-temperature process), manual handling/framing of the module, or the lamination process itself because of the high pressure of 1450 mbar used during the curing phase. The high-pressure lamination process above atmospheric pressure has shown minimal influence on the gel content, with no influence on the peel strength of EVA-based modules [7]. Combining high pressure with the used encapsulant thickness could also be critical for the module's performance due to reduced encapsulation material between the ribbons and the backsheet because high pressure, like 1450 mbar, squeezes a lot of encapsulation material out of the module. The lower the encapsulant thickness, the worse the effect will be. However, this phenomenon can be further investigated.
The results show that faster lamination processes are possible and stable enough to pass the IEC standards. It will be interesting to compare the long-term stability results of processes with higher temperatures than 170 °C.
 |
Fig. 21 Photographs of backsheet wrinkles close to the frame of M23 (left) and M21 (right), leading to cracks in the case of M21. |
 |
Fig. 22 Electroluminescence images of the module M21 − front side − from left to right, after 1000h DH test, after 2000h DH test, and after 3000h DH test. |
 |
Fig. 23 Power loss after different aging test sequences acc. to IEC 61215-2 (left) and extended IEC 61215-2 and IEC 61730-2 (right). |
4 Conclusion
The paper has shown the benefit of a double-side heating system in a lamination process over a single-side heating system. It helped significantly reduce the lamination process time. Forty different lamination processes with various times and temperatures were tested to study the influence of the double-side heating system on the gel content value. Only a GB module with EVA is tested in this study. The DSC degree of crosslinking values for EVA are determined using DSC and later compared with the Soxhlet gel content results. Since Soxhlet's results are more accepted in the industry, they are referenced for the process selection. Figure 16 (right) shows the impact of the double-side heating system in reducing the lamination time, where, theoretically, even 4-minute processes with temperatures ≥165 °C can give a gel content value of more than 75%. Based on the gel content values in Figure 16 (right), Table 5 shows the potential for deduction of lamination time at different temperatures using a double-side heating lamination system with a minimum gel content value of 80% and a minimum lamination time of 5 minutes. The results show that the lamination process can be shortened by 10 to 30% using double-side heating with one heating press compared to standard industrial processes of 7 to 10 minutes of process time using a single-side heating system with two heating steps, depending on the temperature used for lamination. So, if a lamination process with a single-side heating system using 160 °C is changed to double-side heating, the process can be shortened by approximately 3 minutes. The double-side heating system has a higher influence on lower temperature processes. The higher the lamination temperature, the lesser the advantage of double-side heating.
The heating system's influence on the gel content uniformity across the module was also explained in this study. A double-side heating system improves the gel content uniformity compared to a single-side heating system. The impact of a double-side heating system on a module was further investigated by laminating modules and performing temperature profile measurements inside the module using thermocouples. Seven different lamination processes at 170 °C with 6- and 5-minute processes were tested to find the fastest possible lamination process. During trials, it was found that process parameters are crucial for good visual quality, even if the gel content value is well above the target value. The tested modules had no bubbles and cell crack issues, except for the poor backsheet appearance for the first five processes. The poor results were attributed to the exponential jump to high temperature inside the module during the beginning of the cycle in the evacuation phase of the lamination process. Finally, a defect-free, shorter lamination process was developed with a 5 min process time at 170 °C and selected for the long-term stability test.
In the end, the effect of the shorter lamination time using the double-side heating system on the long-term reliability of the module has been investigated. By applying accelerated testing based on qualification testing according to IEC 61215-2 on the modules, the performance degradation described as the power output represents a non-significant deviation of less than −2% after 1000h DH, 200 cycles TC, and 1000h DH followed by mechanical load tests. Additionally, a comparative study of the safety tests of those modules under the influence of two different sequential aging tests named sequence B and B1 according to IEC 61730-2 standards was carried out. In summary, our results clearly show that the modules did not suffer any visual defect or insulation degradation due to the mentioned sequence testing.
Furthermore, extended aging tests up to three times the IEC standard for the DH test and four times the IEC standard for the TC test were carried out to establish the missing link between the criteria for the short lamination process and the test-to-fail module's long-term reliability. The module passed the 2000h DH and the TC 800 extended tests and showed power degradation of not more than 2.5%. However, modules showed significant power reduction after 3000h DH exposure, where −8.4% power loss was observed after the test.
The potential of process time reduction at different lamination temperatures using a double-side heating system.
5 Outlook
Double-side heating systems in a lamination process have the potential to increase the throughput of the module production line. As seen in Table 5, the 160 °C set-temperature process can be shortened by a maximum of 3 minutes. This means that a factory (running 24 h, 320 days/year, 95% uptime, 100% yield, 500Wp module) producing approximately 306 MW per year with a 10-minute cycle time (9-minute process time + 1-minute handling time, 14 modules per cycle) using a single-side heating system can produce 438 MW per year with a 7-minute cycle time (6-minute process time plus 1-minute handling time, 14 modules per cycle). That is approximately a 43% increase in the throughput just by changing the heating system. So, planning a production with roughly 1 GW gross annual capacity will reduce the laminator requirement to only two numbers with double-side heating laminators (giving 876 MW net capacity) instead of three single-side heating laminators with 918 MW net capacity, excluding unscheduled downtime yield loss. The shorter lamination process can be adapted to both one-step and two-step processes. This is useful for upgrading the existing lines to new lines or planning a new factory with higher output and less equipment. However, this comes at an extra cost because the machine has to implement an extra heating plate on top in the heating stage, plus the operation cost during production. The real advantages or disadvantages can be easily checked through the total cost of ownership calculation.
It is also important to note that the above results have showcased the potential of reducing the lamination process time for a specific BOM, especially for PERC cell technology. However, the current market trends have diverted the industry towards other technologies. In recent years, TOPCon (Tunnel oxide passivated contact) and HJT (Heterojunction Technology) have gained significant market share in cell technology for upcoming modules [2]. Roughly 60% of the market share in 2024 is now TOPCon and HJT technology, which will be approximately 80% in the next 6–7 years [2]. Subsequently, this is already changing the type of materials used in the module for good stability, from the kind of wires to encapsulants like POE (polyolefin elastomer) or EPE (coextruded EVA-POE-EVA), due to the reliability issues of these cell technologies [35–37]. The lamination process developed using a double-side heating system will remain relevant for new module layups using POE or EPE. Even if there are some constraints for POE, like shorter process windows, longer evacuation time, and low viscosity [7,37], the process can still be accelerated because double-side heating has more influence on low-temperature processes.
This paper showcases an extensive method for proving a lamination process. A similar methodology can be adopted for developing the glass-glass module lamination process with the latest cell technologies because the GG module is gaining most of the market share, expected to be roughly 70% by 2031 [2].
Acknowledgments
The authors would like to acknowledge Christoph Herzog, formerly from Fraunhofer ISE, for performing the lamination and characterization tests and for his technical support.
Funding
This work was supported in part by the German Federal Ministry for Economic Affairs and Energy (BMWi) in the scope of the project “GEPARD” (contract number. 0324287C).
Conflicts of interest
The authors declare no conflict of interest.
Data availability statement
This article has no associated data generated and/or analyzed / Data associated with this article cannot be disclosed due to legal/ethical/other reason.
Author contribution statement
S. lead conceptualization, methodology, software, validation, formal analysis, investigation, resources, data curation, and writing—original draft preparation. A.K.Ö. contributed to conceptualization, methodology, software, formal analysis, resources, data curation, and writing. D.E.M. contributed to conceptualization, methodology, data curation, and writing. P.G. contributed to conceptualization, methodology validation, formal analysis, funding, supported supervision, writing review, and editing. D.K. contributed to conceptualization, formal analysis, funding, resources, and support supervision. C.W. contributed to conceptualization, funding, and supported supervision. All authors have read and agreed to the published version of the manuscript.
References
- ITRPV, International Technology Roadmap for Photovoltaic (ITRPV): Results 2019, 11th Edition (2020) [Google Scholar]
- ITRPV, International Technology Roadmap for Photovoltaic (ITRPV): Results 2023, 15th Edition (2024) [Google Scholar]
- A. Amrani, A. Mahrane, F.Y. Moussa, Y. Boukennous, Solar module fabrication, Int. J. Photoenergy 2007, 27610 (2007), https://doi.org/10.1155/2007/27610 [CrossRef] [Google Scholar]
- S. Sraisth, Achieving faster lamination process for crystalline photovoltaic modules by using latest lamination technologies, in 33rd European Photovoltaic Solar Energy Conference and Exhibition (2017) pp. 992–997, https://doi.org/10.4229/EUPVSEC20172017-2CV.2.93 [Google Scholar]
- D. Wu, P. Wessel, J. Zhu, D. Montiel-Chicharro, T. R. Betts, A. Mordvinkin, R. Gottschlag, Influence of lamination conditions of EVA encapsulation on photovoltaic module durability, Materials 16, 6945 (2023), https://doi.org/10.3390/ma16216945 [CrossRef] [PubMed] [Google Scholar]
- M. Landa-Pliquet, T. Bejat, M. Serasset, A. Descormes, E. Mofakhami, E. Voroshazi, Enhancing photovoltaic modules encapsulation: optimizing lamination processes for polyolefin elastomers (POE) through crosslinking behavior analysis, Sol. Energy Mater. Sol. Cells 267, 112725 (2024), https://doi.org/10.1016/j.solmat.2024.112725 [CrossRef] [Google Scholar]
- S. Sraisth, A.K. Öz, D. Klaus, C. Wellens, M. Heinrich, Influence of the lamination pressure on the adhesion, degree of cross-linking, and bubble formation of PV modules, in 8th World Conference on Photovoltaic Energy Conversion (2022) pp. 823–829, https://doi.org/10.4229/WCPEC-82022-3DV.1.17 [Google Scholar]
- A.K. Öz, C. Wellens, M. Mittag, M. Wiese, S. Sraisth, D. Klaus, D.H. Neuhaus, M. Heinrich, 2.5 Minutes lamination process and the influences of the degree of cross-linking and the moisture ingress on the degradation of PV modules, in 8th World Conference on Photovoltaic Energy Conversion (2022) pp. 816–822, https://doi.org/10.4229/WCPEC-82022-3DV.1.12 [Google Scholar]
- A.K. Öz, J. Vasani, C. Reichel, C. Wellens, M. Mittag, M. Heinrich, D.H. Neuhaus, Simulation and experimental analysis of temperature profiles and crosslinking in PV module lamination, IEEE J. Photovolt. 14, 777 (2024), https://doi.org/10.1109/JPHOTOV.2024.3414117 [Google Scholar]
- A.K. Öz, C. Herzog, C. Wellens, D.E. Mansour, M. Heinrich, A. Kraft, The impact of the lamination process on the adhesion properties at the glass-encapsulant interface and damp heat stability of PV modules, in 38th European Photovoltaic Solar Energy Conference and Exhibition (2021) pp. 708–714, https://doi.org/10.4229/EUPVSEC20212021-4AV.1.5 [Google Scholar]
- C. Herzog, T. Müller, M. Heinrich, D.H. Neuhaus, Differential scanning calorimetry for simulation and optimization of the lamination process, in 36th European Photovoltaic Solar Energy Conference and Exhibition (2019). DOI:10.4229/EUPVSEC20192019-4AV.1.15 [Google Scholar]
- G. Oreski, A. Rauschenbach, C. Hirschl, M. Kraft, G.C. Eder, G. Pinter, Crosslinking and post-crosslinking of ethylene vinyl acetate in photovoltaic modules. J. Appl. Polym. Sci. 134, 101 (2017), https://doi.org/10.1002/app.44912 [CrossRef] [Google Scholar]
- R.F.M. Lange, Y. Luo, R. Polo, J. Zahnd, The lamination of (multi)crystalline and thin film based photovoltaic modules, Prog. Photovolt.: Res. Appl. 19, 127 (2011), https://doi.org/10.1002/pip.993 [CrossRef] [Google Scholar]
- C. Hirschl, M. Biebl-Rydlo, M. DeBiasio, W. Mühleisen, L. Neumaier, W. Scherf, G. Oreski, G. Eder, B. Chernev, W. Schwab, M. Kraft, Determining the degree of crosslinking of ethylene vinyl acetate photovoltaic module encapsulants − a comparative study, Sol. Energy Mater. Sol. Cells 116, 203 (2013), https://doi.org/10.1016/j.solmat.2013.04.022 [CrossRef] [Google Scholar]
- D. E. Mansour, C. Herzog, P. Christoefl, L. P. Bauermann, G. Oreski, A. Schuler, D. Philipp, P. Gebhardt, Nanoindentation reveals crosslinking behavior of solar encapsulants—the methodological advantages over bulk methods, Polymers 13, 3328 (2021), https://doi.org/10.3390/polym13193328 [CrossRef] [PubMed] [Google Scholar]
- S. Lust, T. Weber, S. R. Kuntamukkula, A. Mordvinkin, M. Wendt, Update of quality control tests for new PV encapsulation materials, EPJ Photovolt. 15, 5 (2024), https://doi.org/10.1051/epjpv/2024006 [CrossRef] [EDP Sciences] [Google Scholar]
- F.J. Pern, A.W. Czanderna, Characterization of Ethylene Vinyl Acetate (EVA) encapsulant: effects of thermal processing and weathering degradation on its discoloration, Sol. Energy Mater. Sol. Cells 25, 3 (1992), https://doi.org/10.1016/0927-0248(92)90013-F [CrossRef] [Google Scholar]
- M. Baiamonte, C. Colletti, A. Ragonesi, C. Gerardi, N.T. Dintcheva, Durability and performance of encapsulant films for bifacial heterojunction photovoltaic modules, Polymers 14, 1052 (2022), https://doi.org/10.3390/polym14051052 [CrossRef] [PubMed] [Google Scholar]
- G. Cattaneo, A. Faes, H.-Y. Li, F. Galliano, M. Gragert, Y. Yao, R. Grischke, T. Söderström, M. Despeisse, C. Ballif, L.-E. Perret-Aebi, Lamination process and encapsulation materials for glass-glass PV module design, Photovolt. Int. 82 (2015) [Google Scholar]
- B-Å. Sultan, E. Sörvik, Thermal degradation of EVA and EBA—A comparison. I. Volatile decomposition products, J. Appl. Polym. Sci. 43, 1737 (1991), https://doi.org/10.1002/app.1991.070430917 [CrossRef] [Google Scholar]
- G. Oreski, A. Mihaljevic, Y. Voronko, G.C. Eder, Acetic acid permeation through photovoltaic backsheets: influence of the composition on the permeation rate, Polym. Test. 60, 374 (2017), https://doi.org/10.1016/j.polymertesting. 2017.04.025 [CrossRef] [Google Scholar]
- G.W. Ehrenstein, G. Riedel, P. Trawiel, Thermal Analysis of Plastics: Theory and Practice (Hanser Gardner Publications, 2004), pp. 1–110, https://doi.org/10.3139/9783446434141.001 [Google Scholar]
- O. Bianchi, R.V.B. Oliviera, R. Fiorio, J. De N. Martins, A. J. Zattera, L. B. Canto, Assessment of Avrami, Ozawa and Awrami-Ozawa equations for determination of EVA crosslinking kinetics from DSC, Polym. Test. 26, 722 (2008), https://doi.org/10.1016/j.polymertesting.2008.05.003 [CrossRef] [Google Scholar]
- C. Hirschl, L. Neumaier, S. Puchberger, W. Mühleisen, G. Oreski, G.C. Eder, R. Frank, M. Tranitz, M. Schoppa, M. Wendt, N. Bogdanski, A. Plösch, M. Kraft, Determination of the degree of ethylene vinyl acetate crosslinking via Soxhlet extraction: Gold standard or pitfall?, Sol. Energy Mater. Sol. Cells 143, 494 (2015), https://doi.org/10.1016/j.solmat.2015.07.043 [CrossRef] [Google Scholar]
- M. Shahid, M. Yusuf, F. Mohammad, Plant phenolics: a review on modern extraction techniques, in Recent Progress in Medicinal Plants: Analytical and Processing Techniques (Studium Press LLC, USA, 2016), Vol. 41, pp. 265–287, https://www.researchgate.net/publication/310614780 [Google Scholar]
- Robert Buerkle GmbH, Prospekt PV Lamination Lines EN, 14 May 2018. [Online]. Available: https://www.burkle.tech/fileadmin/user_upload/Downloads_DE_EN_US/Prospekt_PV_Lamination_Lines_EN.pdf. [Accessed 20 June 2024] [Google Scholar]
- M. Köntges, S. Kurtz, C. Packard, U. Jahn, K.A. Berger, K. Kato, Performance and reliability of photovoltaic systems subtask 3.2: Review of failures of photovoltaic modules, IEA PVPS task 13, external final report, Photovoltaic Power Systems Programme, Report IEA-PVPS T13-01:2014 (2014). DOI:10.2314/GBV:856979287 [Google Scholar]
- S. Deitsch, V. Christlein, S. Berger, C. Buerhop-Lutz, A. Maier, F. Gallwitz, C. Riess, Automatic classification of defective photovoltaic module cells in electroluminescence images, Sol. Energy 185, 455 (2019), https://doi.org/10.48550/arXiv.1807.02894 [CrossRef] [Google Scholar]
- A.H.M. Smets, K. Jaeger, O. Isabella, R. van Swaaij, M. Zeman, Solar energy: The physics and engineering of photovoltaic conversion, technologies and systems (Cambridge, England: UIT Cambridge, 2016) [Google Scholar]
- International Electrotechnical Commission. Terrestrial photovoltaic (PV) modules − Design qualification and type approval − Part 1-1: Special requirements for testing of crystalline silicon photovoltaic (PV) module (Geneva, Switzerland, 2016) [Google Scholar]
- D.E. Mansour, C. Barretta, L.P. Bauermann, G. Oreski, A. Schüler, D. Philipp, P. Gebhardt, Effect of backsheet properties on PV encapsulant degradation during combined accelerated aging tests, Sustainability 12, 5208 (2020), https://doi.org/10.3390/su12125208 [CrossRef] [Google Scholar]
- A.K. Singh, R. Singh, The effect of degree of gel content of EVA encapsulant on the properties of encapsulant itself and finally on the reliability of the solar module on the field, Renewsys India Pvt. Ltd., 2017. https://www.renewsysworld.com/_files/ugd/f7d549_0be81b9302ad49caaab73bc5cb28dabd.pdf?index=true [Google Scholar]
- P. Romer, G. Oreski, A. Beinert, D. Neuhaus, M. Mittag, More realistic consideration of backsheets coefficient of thermal expansion on thermomechanics of PV modules, in 37th European Photovoltaic Solar Energy Conference and Exhibition (2020) pp. 772–776, https://doi.org/10.4229/EUPVSEC20202020-4BO.11.4 [Google Scholar]
- J. Markert, S. Kotterer, D.E. Mansour, D. Philipp, P. Gebhardt, Advanced analysis of backsheet failures from 26 power plants, EPJ Photovolt. 12, 7 (2021), https://doi.org/10.1051/epjpv/2021006 [CrossRef] [EDP Sciences] [Google Scholar]
- P.M. Sommeling, J. Liu, J.M. Kroon, Corrosion effects in bifacial crystalline silicon PV modules; interactions between metallization and encapsulation, Sol. Energy Mater. Sol. Cells 256, 112321 (2023), https://doi.org/10.2139/ssrn.4259062 [CrossRef] [Google Scholar]
- C. Sen, H. Wang, X. Wu, M.U. Khan, C. Chan, M. Abott, B. Hoex, Four failure modes in silicon heterojunction glass-backsheet modules, Sol. Energy Mater. Sol. Cells 257, 112358 (2023), https://doi.org/10.1016/j.solmat.2023. 112358 [CrossRef] [Google Scholar]
- J. Zuboy, M. Springer, E.C. Palmiotti, J. Karas, B.L. Smith, M. Woodhouse, T.M. Barnes, Getting ahead of the curve: assessment of new photovoltaic module reliability risks associated with projected technological changes, IEEE J. Photovolt. 14, 4 (2024), https://doi.org/10.1109/JPHOTOV.2023.3334477 [CrossRef] [Google Scholar]
Cite this article as: Sraisth, Djamel Eddine Mansour, Aksel Kaan Öz, Paul Gebhardt, Daniel Klaus, Christine Wellens, Reducing process time of PV module lamination by using double-side heating system, EPJ Photovoltaics 16, 26 (2025), https://doi.org/10.1051/epjpv/2025014
All Tables
The potential of process time reduction at different lamination temperatures using a double-side heating system.
All Figures
|
Fig. 1 Layup of glass-backsheet (GB) solar module [Buerkle]. |
| In the text | |
|
Fig. 2 Two-stage PV module lamination processes. |
| In the text | |
|
Fig. 3 Three-stage PV module lamination processes. |
| In the text | |
|
Fig. 4 Description of the complete experiment in two phases. |
| In the text | |
|
Fig. 5 Lab Laminator used for gel content sample preparation and process optimization at Buerkle. |
| In the text | |
|
Fig. 6 Gel content sample preparation layup (left) and five different locations per lamination process (right). |
| In the text | |
 |
Fig. 7 Behrotest Soxhlet extraction apparatus (left) and schematic model of apparatus [25] (right). |
| In the text | |
|
Fig. 8 Temperature measurement module sample with six thermocouples (left) and layup (right). |
| In the text | |
|
Fig. 9 Mechanical load test on the module (left), applied load in Pa, and measured deflection in mm (right). |
| In the text | |
|
Fig. 10 Description of Sequence B and B1 (IEC 61730-2). |
| In the text | |
|
Fig. 11 UV chamber TLPV, spectral distribution. |
| In the text | |
|
Fig. 12 DSC degree of crosslinking of the single-side heating lamination process for different temperatures and process times at five different positions on the module. |
| In the text | |
|
Fig. 13 DSC degree of crosslinking of the double-side heating lamination process for different temperatures and process times at five different positions on the module. |
| In the text | |
|
Fig. 14 Comparison between the degree of crosslinking values of single-side (left) and double-side heating (right) lamination process over different temperature and time processes. |
| In the text | |
|
Fig. 15 Comparison between the DSC degree of crosslinking (left) and Soxhlet gel content values (right) of the single-side heating lamination process. |
| In the text | |
|
Fig. 16 Comparison between the DSC degree of crosslinking (left) and Soxhlet gel content values (right) of the double-side heating lamination process. |
| In the text | |
|
Fig. 17 60 cells GB PERC module laminated for process optimization, front side (left) and rear side (right). |
| In the text | |
|
Fig. 18 GB PV module with poor backsheet optic (top) and good backsheet optic (bottom). |
| In the text | |
|
Fig. 19 Lamination temperature profile of six different locations inside the module for the 5 min process at 170 °C using a double-side heating system. |
| In the text | |
|
Fig. 20 Lamination temperature profile of five different processes inside the module at 170 °C using a double-side heating system. |
| In the text | |
|
Fig. 21 Photographs of backsheet wrinkles close to the frame of M23 (left) and M21 (right), leading to cracks in the case of M21. |
| In the text | |
|
Fig. 22 Electroluminescence images of the module M21 − front side − from left to right, after 1000h DH test, after 2000h DH test, and after 3000h DH test. |
| In the text | |
|
Fig. 23 Power loss after different aging test sequences acc. to IEC 61215-2 (left) and extended IEC 61215-2 and IEC 61730-2 (right). |
| In the text | |
Current usage metrics show cumulative count of Article Views (full-text article views including HTML views, PDF and ePub downloads, according to the available data) and Abstracts Views on Vision4Press platform.
Data correspond to usage on the plateform after 2015. The current usage metrics is available 48-96 hours after online publication and is updated daily on week days.
Initial download of the metrics may take a while.