


| Issue |
EPJ Photovolt.
Volume 17, 2026
Special Issue on ‘EU PVSEC 2025: State of the Art and Developments in Photovoltaics', edited by Robert Kenny and Carlos del Cañizo
|
|
|---|---|---|
| Article Number | 25 | |
| Number of page(s) | 15 | |
| DOI | https://doi.org/10.1051/epjpv/2026017 | |
| Published online | 03 July 2026 | |
https://doi.org/10.1051/epjpv/2026017
Original Article
Impact of cell cracks on performance of PV modules with current cell technologies
1
Hochschule Anhalt - Anhalt University of Applied Sciences, Bernburger Str. 55, 06366 Köthen, Germany
2
Fraunhofer Center for Silicon Photovoltaics CSP, Otto-Eissfeldt-Str. 12, 06120 Halle (Saale), Germany
* e-mail: This email address is being protected from spambots. You need JavaScript enabled to view it.
Received:
30
September
2025
Accepted:
5
June
2026
Published online: 3 July 2026
Abstract
Cracks in photovoltaic modules can affect power output, but their relevance depends on module architecture and operating conditions. This study examines how crack length and crack number relate to power loss in 230 mono-Si mini-modules spanning full-cell PERC and half-cut TOPCon technologies with busbar counts from 2 to 12, focusing exclusively on cell line cracks that do not lead to electrically isolated cell parts. Electroluminescence images were used to quantify crack characteristics and busbars, while current–voltage measurements at 200 W/m2 and 1000 W/m2 were used to extract series resistance, shunt resistance, and maximum power point. Correlation analysis was then used to assess how crack characteristics relate to electrical performance. The results show that crack length and crack number are not universal predictors of power loss in modern modules. PERC modules exhibit moderate crack–power correlations at low irradiance, but these correlations weaken at 1000 W/m2. TOPCon modules show no meaningful correlation at either irradiance level. The results indicate that crack sensitivity is governed primarily by irradiance, busbar count, and cell architecture, rather than by crack length alone.
Key words: PV modelling / electroluminescence / crack detection, power loss / shunt resistance
© A. Hashem et al., Published by EDP Sciences, 2026
 This is an Open Access article distributed under the terms of the Creative Commons Attribution License (https://creativecommons.org/licenses/by/4.0), which permits unrestricted use, distribution, and reproduction in any medium, provided the original work is properly cited.
1 Introduction
Assessing the reliability of PV modules, the fundamental building blocks of solar installations, is essential to ensuring long-term system performance. Cracks in PV modules can develop at several stages: during silicon ingot cutting, cell manufacturing, module fabrication, transportation, or installation, or under environmental factors such as snow loads, winds, or hail [1–3]. This work focuses on cracks arising from module production through end of life, as these represent the crack origins most relevant to in-service energy production and long-term reliability assessment. Multiple definitions of cracks exist, often distinguishing them by parameters such as physical size, orientation relative to the metal grid, and the extent of penetration into the wafer. By extent, they are classified as either complete—extending uninterrupted from one cell edge to the other—or incomplete, terminating at an arbitrary point within the cell [4]. A further categorization considers orientation relative to BB [5–7], distinguishing whether they run parallel, perpendicular, or at ±45° (diagonal) to the BB, in addition to identifying dendritic and multidirectional patterns.
Cracks in PV modules can impair performance by disrupting electrical conductivity and increasing resistive losses, with affected cells dissipating rather than generating power [8–11]. Over 6 yr of outdoor operation, electrically isolated cell areas due to microcracks increased by 19.1%, driving an average annual initial STC power loss of 1.5% [12]. Several studies have reported that power loss increases with the electrically inactive area created by cracks, particularly in conventional multi-crystalline silicon (mc-Si) modules subjected to mechanical loading [13,14], with reported microcrack-induced output power losses ranging from 0.9% to 42.8% depending on the extent of the inactive area [15]. Studies on the electrical modeling of cracked modules emphasize the extraction of Rs and Rsh as indicators of module health as they are affected by cracking [16], with cracked area directly reducing photocurrent (Iph) and significantly lowering the equivalent Rsh [17]; these effects directly translate into Pmpp losses through increased leakage. The ideality factor (n) and saturation current (Io) typically show little change [18]. These performance and modeling findings are predominantly based on older mc-Si cell architectures with two to three BBs and may not translate directly to modern mono-Si technologies. Today's dominant technologies increasingly use G12 wafer formats, significantly higher BB numbers, and are rapidly gaining market share, with even larger wafer sizes expected beyond 2028 [19]. Higher BB numbers reduce the worst-case crackable area per cell and improve current collection efficiency [20,21], so that line cracks often exhibit a substantially smaller electrical impact than fully isolated cell areas [22]. While one study investigated crack impacts on mono-Si and mc-Si PERC modules with 2–5 BBs and reported power degradation differences across different BB numbers [23], it was limited to PERC technology and did not examine more than 5 BB or changes in physical parameters.
Although several studies have reported a direct relationship between crack number/length and power loss in mc-Si modules [24–27], this assumption has increasingly been questioned. Crack location within modules also matters, since multiple cracks distributed across different substring cells do not cumulatively increase losses but are governed by the highest-impact individual crack. Furthermore, field studies have confirmed that outdoor PV modules routinely operate across wide irradiance ranges [12], motivating investigation of crack sensitivity under varying illumination conditions. The effects of modern cell architecture on crack-induced physical parameters (Rs and Rsh) and whether crack severity scales with crack number or length in high-BB modules under varying irradiance conditions remain unexplored.
To address this gap, this study aims to investigate whether crack length and number are reliable predictors of power loss by understanding the impact of cracks on power degradation across different module technologies with varying BB configurations and operating conditions, with Rs and Rsh examined as physical evidence of the underlying resistive mechanisms.
2 PV modelling and crack detection
This study relies on two complementary experimental inputs: the measured I–V curve, which encodes the complete electrical response of a PV module under controlled illumination, and EL images, which provide a spatially resolved map of crack structures within the cells. I–V curves are measured to extract Pmpp and physical parameters Rs and Rsh, which serve as evidence of crack-induced resistive changes, while the EL images are processed to extract automatically the total crack length and crack number. The systematic variation of these electrical parameters and power output with the extracted crack characteristics across different BB configurations and irradiance levels forms the basis of the correlation analysis presented in Section 4.3.
2.1 Single-diode model
The single-diode model (SDM) is widely used for PV modeling due to its balance between accuracy and simplicity, as it is based on the well-known Shockley diode equation [28]. Figure 1 summarizes the dominant physical processes of a PV device using an equivalent electrical circuit consisting of a limited number of elements. By applying Kirchhoff’s laws, the output current–voltage relationship can be expressed as shown in Equation (1):
 (1)
(1)
Here, I is the output current, V is the output voltage, IL is the light current, Io is the diode saturation current, n is the diode ideality factor, Rs is the series resistance, Rsh is the shunt resistance, Ns is the number of cells in series, and Vt is the diode thermal voltage. This formulation assumes all cells within the module are assumed to be electrically identical, operating under uniform irradiance and temperature conditions. In addition to the single-diode model, the two-diode model is frequently employed in the literature to represent both diffusion and recombination losses [29]. However, in the present study, the increased computational complexity and execution time of the two-diode formulation did not yield a measurable improvement in fitting accuracy or in the extracted resistive parameters. Since the primary objective of this work is to assess whether crack characteristics drive power loss, with Rs and Rsh serving as physical indicators of resistive changes. The SDM was therefore selected, as it provides robust estimates of these parameters while ensuring computational efficiency and consistency across large datasets.
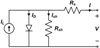 |
Fig. 1 Single-diode model electrical circuit. |
2.2 Parameter extraction techniques utilizing the single-diode model
Extracting the five SDM parameters (1L, Io, Rs, Rsh, and n) from I–V data requires dedicated parameter extraction techniques, as manufacturers’ datasheets typically provide only a limited number of operating points at STC. Extraction techniques generally fall into three broad classes: analytical, numerical, and hybrid methods [30,31]. Several SDM parameter-extraction approaches were considered and compared, including hybrid analytical–iterative methods (Cubas and Villalva) [32,33], an analytical formulation implemented in PVLib [34], a fully iterative optimization approach based on particle swarm optimization [35], and a slope-based resistance estimation method [36]. Selection criteria were based on accuracy of reconstructed I–V curve key points (Isc, Voc, Pmpp, and fill factor (FF)). Among the tested approaches, the analytical method proposed by Cubas et al. [32] showed the best overall agreement and the lowest deviations for all key points across both module technologies. It extracts the five SDM parameters using only the three characteristic points from manufacturer datasheets: Isc, Voc, and Pmpp. Closed-form expressions are derived by applying Kirchhoff’s laws at these points, with the maximum power condition explicitly imposed as a boundary condition. Rs is resolved first, after which the remaining parameters follow algebraically. It was therefore adopted as the extraction technique for all subsequent correlation analyses presented in Section 4.3.
2.3 Crack detection
Non-destructive evaluation techniques, including photoluminescence, infrared thermography, and ultrasonic testing, have been developed for detecting cracks in PV modules [37,38]. Among these, EL imaging has become the preferred technique due to its non-destructive nature, high spatial resolution, and sensitivity to electrically active defects [39–42]. By forward biasing the cell and capturing infrared emission, EL imaging reveals microcracks that disrupt carrier transport, often before they manifest as measurable performance losses. To quantify the number and length of cracks, an OpenCV-based image-processing algorithm was developed and applied to EL images. The workflow consists of four main stages: perspective correction, cell detection, BB removal, and crack detection with length measurement. First, a perspective transformation is applied using the module contour and known real-world dimensions to ensure geometrical accuracy. Individual cell contours are then detected to construct a standard cell matrix, enabling the conversion of pixel dimensions to physical units. To minimize interference during crack detection, BBs are identified by vertical pixel-intensity summation and removed from the images. Finally, crack structures are extracted using adaptive thresholding and morphological filtering, followed by skeletonization to single-pixel-width paths. Total crack length is defined as the sum of the skeletonized pixel lengths of all detected crack segments across all cells in the module, converted to physical units (mm). Crack number is defined as the total number of unique connected crack segments detected at the module level, aggregated across all cells. Figure 2 illustrates the complete workflow and provides a representative example of the detection results.
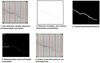 |
Fig. 2 Crack detection workflow. |
3 Sample preparation
Having defined the modeling framework in Section 2, this section describes the experimental samples and measurement procedures from which the input data for the parameter extraction and correlation analyses are derived.
The proposed framework was demonstrated using mono-Si mini-modules representing two distinct mono-Si cell technologies: PERC and TOPCon. All samples were based on M6 wafer formats and featured different BB configurations. The PERC mini-modules consisted of six full-size cells, covering BB numbers from 2 to 9. The TOPCon mini modules consisted of 12 half-cut cells, extending up to 12 BBs, yielding 111 PERC and 119 TOPCon mini-modules. Unlike full-size cells, the half-cut format halves the current per substring, reducing I2R losses and shortening lateral current paths—both of which influence how cracks translate into resistive parameter changes. Mini-modules were intentionally selected to isolate cell-level crack effects; in full-size modules, bypass diodes and substring wiring introduce additional complexity that would obscure the direct relationship between crack characteristics and the fundamental electrical parameters investigated here. The crack–power correlations reported in this work therefore reflect intrinsic cell-level behavior, providing a controlled and technology-comparable baseline that is a necessary precondition for any future extension to full-size module configurations.
I–V curve measurements and EL imaging characterized all samples electrically and optically at two irradiance levels: 1000 W/m2 (STC) and 200 W/m2 (low-light conditions). A Halm A+A+A+ flasher performed all measurements with module temperature maintained at 25°C. The EL camera was integrated into the flasher system, enabling simultaneous acquisition of EL images with I–V measurements. Although TOPCon cells can exhibit hysteresis under short-pulse flash testing, this effect was found to be negligible for the investigated samples and measurement protocol. Therefore, only forward Isc→Voc measurements were used for I–V curve evaluation. All measurements were conducted under controlled laboratory conditions at Fraunhofer CSP.
4 Results
This section presents the results in three sequential steps. First, the crack quantification outputs from the EL image processing are presented to characterize the crack distribution across the dataset. Second, the uncertainty of the extracted parameters and their physical consistency against crack-free baselines. Finally, correlation analysis directly addresses the central question of this work: whether crack total length or crack number can predict Pmpp loss in modern PERC and TOPCon modules, with Rs and Rsh shifts examined as mechanistic evidence.
4.1 Crack detection
Representative EL images processed using the proposed crack-detection algorithm described in Section 2.3 are shown in Figure 3. In both panels, detected cracks are overlaid, highlighting both continuous and branching crack structures. Showing the corresponding skeletonized representations in green, with individual crack segments identified and their total lengths quantified in millimeters. Each detected crack segment is assigned a unique identifier (ID) during the connected-component labeling step (as shown in the zoomed panel). The crack number is then computed as the total number of unique IDs detected within a cell, aggregated at the module level. The results demonstrate that the algorithm detects crack patterns of varying orientation and complexity in both modules, enabling consistent, automated crack quantification across the whole dataset.
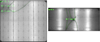 |
Fig. 3 Crack detection results for TOPCon (right) and PERC (left). |
4.2 Physical parameters extraction
4.2.1 Uncertainty measurements
Before analyzing crack–parameter–power correlations, the uncertainty of the parameter-extraction procedure is quantified to ensure observed trends exceed the intrinsic variability of the modeling approach. As introduced in Section 2.2, the Cubas method first optimizes n before extracting the remaining SDM parameters by iterating n over the range 0 to 3 in steps of 0.01. The optimized ideality-factor values obtained from this procedure are 1 and 1.3 for PERC modules at 200 and 1000 W/m2, respectively, and 1 and 1.38 for TOPCon modules at 200 and 1000 W/m2, respectively. Using this optimized extraction framework, deviations between measured and reconstructed I–V curve key points were evaluated across the whole dataset, as shown in Figure 4. The resulting distributions exhibit minimal systematic deviations and limited spread, with median errors close to zero for Isc and FF, and median absolute deviations remaining below approximately 0.5% for all power-relevant quantities. In particular, the extracted Pmpp shows a narrow distribution with a median deviation of −0.41%, indicating a high stability of the fitting procedure enabled by the ideality-factor optimization. The subsequent correlations between crack length, resistive parameters, and power loss can therefore be confidently attributed to physical crack-induced effects rather than artifacts arising from the parameter-extraction methodology.
The extracted Rs and n values were additionally cross-checked against literature reference values for PERC [43,44] and TOPCon [45,46] and found to fall within their respective expected ranges, confirming the physical plausibility of the extraction procedure.
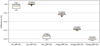 |
Fig. 4 Uncertainty measurements of key points extraction. |
4.2.2 Crack-free baseline
To isolate crack-induced effects from intrinsic module properties, series and shunt resistances were first evaluated on crack-free modules across all BB configurations at both irradiance levels, as summarized in Figure 5. For both technologies, Rs shows an apparent, physically consistent decrease with increasing BB number at both irradiance levels, reflecting reduced lateral current-collection distances, with its magnitude remaining irradiance-dependent.
This irradiance dependence is more pronounced for TOPCon than for PERC modules, as in PERC modules, the rear aluminum back surface contact behaves as a near-ohmic junction with relatively weak injection-level sensitivity, resulting in a modest Rs separation between the two irradiance conditions. In contrast, the TOPCon tunneling oxide passivation contact exhibits a stronger injection-level dependence. Similar trends were observed experimentally and through simulations [47,48].
In contrast, shunt resistance is not expected to exhibit a systematic dependence on BB number, as it is primarily governed by bulk- and junction-related leakage pathways rather than by lateral current-collection geometry. Instead, Rsh exhibits a markedly broader spread and a pronounced inverse dependence on irradiance, reflecting its practical, injection-dependent nature. This dependence is documented in the literature and has been reported for a wide range of PV technologies [49].
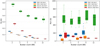 |
Fig. 5 Rs and Rsh values for crack-free modules. |
4.3 Correlation analysis
This subsection investigates the statistical correlation between total crack length and number, extracted physical parameters (Rs and Rsh), and Pmpp across modern mono-Si PV modules using the Pearson correlation coefficient (r). Here, the extracted physical parameters are examined not as independent results, but as mechanistic evidence explaining the physical pathways through which cracks may or may not cause power loss.
Correlation analyses were performed separately for PERC and TOPCon technologies, covering a wide range of BB numbers and two irradiance levels (200 and 1000 W/m2), using the Cubas extraction method selected in Section 4.2. The objective is to examine the correlation among the aforementioned parameters to determine whether crack characteristics alone can serve as a reliable predictor of electrical degradation.
4.3.1 PERC modules
At low irradiance, PERC modules exhibit a moderate correlation between crack characteristics and the extracted electrical parameters, as shown for the Pmpp in Figure 6 and summarized in Table 1. The series resistance shows a moderate positive correlation for both metrics, indicating that longer cracks increasingly disrupt lateral current collection. In parallel, the shunt resistance exhibits a moderate negative correlation across the metrics, suggesting that longer cracks increase the probability of electrically active leakage pathways under low-field conditions. These trends highlight that crack-induced transport and leakage effects are most pronounced at reduced irradiance. Under STC conditions, the sensitivity of the extracted parameters to cracking weakens. While some scatter remains visible, the correlations reduce, reflecting partial compensation by increased photogenerated current and stronger internal electric fields. Apparent clustering by BB configuration indicates that current-collection geometry dominates the electrical response at high irradiance, with cracking acting as a secondary perturbation.
This behavior is also reflected in the relationship between cracking and Pmpp. The low-irradiance data hints at a possible threshold behavior: for total crack lengths below approximately 600 mm, Pmpp remains relatively stable across BB configurations, while modules with total crack lengths exceeding 600 mm tend to show lower Pmpp values, particularly for low BB numbers (2BB case). A similar tendency is observed beyond 21 cracks. However, given the limited number of modules in these high-crack ranges, these observations are reported here as initial indications that merit further investigation with a larger and more balanced dataset. For completeness, the corresponding scatter plots for Rs and Rsh are provided in the Appendix.
This behavior contrasts with the simple “more cracks = more power loss” relationship often reported for mc-Si modules [24–27]. At STC, Pmpp remains relatively stable across the full range of crack number and length, and BB configurations show lower correlation coefficients, confirming that power output is substantially less sensitive to cracking under high-irradiance conditions. These results show that for PERC modules, crack impact can be seen only at low irradiance, and high crack numbers do a moderate relationship emerges, and even then, BB number dominates the response.
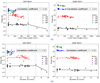 |
Fig. 6 Scatter plots of Pmpp versus crack total length (a) and number of cracks (b) for PERC modules alongside with the mean correlation coefficient. |
Mean correlation coefficient for PERC modules.
4.3.2 TOPCon modules
Across both irradiance levels, TOPCon modules exhibit no systematic correlation between crack characteristics and the extracted physical parameters, as shown for Pmpp in Figure 7 and summarized in Table 2. No meaningful correlation is observed across all BB configurations, indicating that the electrical response of TOPCon modules is largely insensitive to the observed cracking range. This reduced sensitivity to cracking reflects the improved electrical robustness of TOPCon modules, in which the half-cell layout shortens lateral current paths and lowers the current per string, thereby reducing I2R losses and promoting more uniform current extraction [50]. This confirms that TOPCon architecture poses essentially no measurable electrical risk from cracking within the investigated range.
For completeness, the corresponding scatter plots for Rs and Rsh are provided in the Appendix.
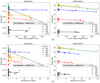 |
Fig. 7 Scatter plots of Pmpp versus crack total length (a) and number of cracks (b) for TopCon modules alongside with the mean correlation coefficient. |
Mean correlation coefficients for TOPCon modules.
4.4 Discussion
There is a consistent observation that crack–power correlations are stronger at 200 W/m2 than at 1000 W/m2 and that this irradiance dependence becomes more pronounced at higher BB counts. As cracks introduce locally enhanced leakage pathways that reduce the effective Rsh. At 1000 W/m2, the large photogenerated current dominates the operating point, and the fractional contribution of the shunt leakage to total power loss is small. At 200 W/m2, however, photocurrent is proportionally reduced while the junction voltage and thus the shunt leakage current remains comparably high. The stronger irradiance dependence at higher BB counts is consistent with this mechanism: with more busbars, crack-induced lateral Rs penalties are suppressed, and the crack-induced shunt is more likely to remain well connected to a nearby busbar, allowing shunt current to flow more efficiently.
To further interpret the correlations reported above, an averaged pooled Pearson correlation heatmap was constructed across all 230 modules (PERC+TopCon) in Figure 8. The dominant finding is the strong negative correlation between BB count and Pmpp loss with r = −0.59, confirming that busbar architecture is the primary structural factor governing crack sensitivity in the pooled dataset. Crack length and crack number show moderate positive correlations with Pmpp loss (r = 0.28 and 0.38, respectively), consistent with the technology-separated results in Sections 4.3.1 and 4.3.2, where PERC drives the signal and TOPCon contributes near-zero values. The negative correlation between is_TOPCon and Pmpp loss, r = −0.21, reflects the superior crack tolerance of TOPCon modules established above due to the enhanced half-cut layout and increasing BB count. Where is_TOPCon is a binary indicator variable assigned a value of 1 for TOPCon modules and 0 for PERC modules.
This overlap between irradiance, technology type, and BB count reinforces the need to interpret crack–power relationships within these parameters as specific subgroups, as done throughout this work.
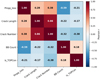 |
Fig. 8 Mean correlation heat-map across the pooled dataset. |
5 Conclusion
This study investigates the impact of line cracks on power loss on mini-modules with different technologies, irradiance levels, and BB counts where no isolated part occurs. It shows that crack length and crack number are not universal predictors of power loss in modern PV mini-modules. Their effect depends on module architecture and irradiance, with PERC showing moderate crack sensitivity only at 200 W/m2 and TOPCon showing no meaningful correlation at either irradiance level. The crack-free baselines confirm the expected dependence of Rs and Rsh on busbar configuration and irradiance, and the crack-related trends in PERC are consistent with increased current-collection loss and leakage under low-light conditions. In contrast, the near-zero correlations observed for TOPCon indicate that the half-cut architecture is less susceptible to crack-induced electrical losses within the investigated range. These results demonstrate that crack-based performance assessment must be technology- and architecture-specific and operating-condition dependent. For modern mono-Si modules, especially high-busbar TOPCon designs, crack length and crack number are not sufficient standalone indicators of electrical degradation. The findings provide a laboratory-based basis for improved crack assessment, while full-module field validation remains a necessary next step.
Funding
The authors gratefully acknowledge financial support from the German Federal Ministry for Economic Affairs and Climate Action (BMWK) for the project “PV-Riss” with grant #03TN0033A and “Folie40 – Modellierung der foliendefinierten Moduldegradation” with grant 03EE1173E and the financial support from the Bundesministerium für Bildung und Forschung (BMBF) for the project “InitFDM” with grant #16FDFH127.
Conflicts of interest
There are no financial conflicts of interest. There are no specific trade names or similar used.
Data availability statement
Data used are available upon request.
Author contribution statement
Ahmad Hashem: Parameter extraction, correlation results, and paper writing. Zonghan Jiang: Image processing. Guido Willers: Correlation analysis. Bengt Jaeckel and Ralph Gottschalg: Methodology design, data sharing, and supervision. Leila Mortazavifar: Manuscript refinement.
References
- S.-T. Hsu, Y.-S. Long, Y.-T. Li, Characterization of solar cells in transportation, in 2014 IEEE 40th Photovoltaic Specialist Conference (PVSC) (IEEE, 2014), p. 2592 [Google Scholar]
- X. Gou, X. Li, S. Wang et al., The effect of microcrack length in silicon cells on the potential induced degradation behavior, Int. J. Photoenergy 2018, 1 (2018) [Google Scholar]
- M. Köntges, S. Kurtz, C. Packard et al., Performance and reliability of photovoltaic systems: Subtask 3.2: Review of failures of photovoltaic modules: IEA PVPS task 13: external final report IEA-PVPS (International Energy Agency Photovoltaic Power Systems Programme, Sankt Ursen, 2014) [Google Scholar]
- B. Jaeckel, M. Pander, P. Schenk et al., Nomenclature and description of electro-luminescence (EL) observations: cell cracks and other observations, EPJ Photovolt. 15, 44 (2024) [Google Scholar]
- S. Kajari-Schröder, I. Kunze, U. Eitner et al., Spatial and orientational distribution of cracks in crystalline photovoltaic modules generated by mechanical load tests, Sol. Energy Mater. Sol. Cells 95, 3054 (2011) [Google Scholar]
- M. Köntges, S. Kajari-Schröder, I. Kunze, U. Jahn, Crack statistic of crystalline silicon photovoltaic module, Sol. Energy Mater. Sol. Cells 95, 3054 (2011) [Google Scholar]
- M. Sander, S. Dietrich, M. Pander et al., Systematic investigation of cracks in encapsulated solar cells after mechanical loading, Sol. Energy Mater. Sol. Cells 111, 82 (2013) [Google Scholar]
- A.M. Gabor, E.J. Schneller, H. Seigneur et al., The impact of cracked solar cells on solar panel energy delivery, in 2020 IEEE 47th Photovoltaic Specialists Conference (PVSC) (IEEE, 2020), p. 810 [Google Scholar]
- A. Dolara, G.C. Lazaroiu, S. Leva et al., Snail trails and cell microcrack impact on PV module maximum power and energy production, IEEE J. Photovolt. 6, 1269 (2016) [Google Scholar]
- V. Gade, N. Shiradkar, M. Paggi et al., Predicting the long term power loss from cell cracks in PV modules, in 2015 IEEE 42nd Photovoltaic Specialist Conference (PVSC) (IEEE, 2015), p. 1 [Google Scholar]
- C.A. Rodriguez Castaneda, S. Chattopadhyay, J. Oh et al., Field inspection of PV modules: Quantitative determination of performance loss due to cell cracks using EL images, in 2017 IEEE 44th Photovoltaic Specialist Conference (PVSC) (IEEE, 2017), p. 1858 [Google Scholar]
- B. Jaeckel, T. Franke, J. Arp, Long term statistics on micro cracks and their impact on performance, in 33rd European Photovoltaic Solar Energy Conference (Amsterdam, 2017) [Google Scholar]
- E.J. Schneller, R. Frota, A.M. Gabor, J. Lincoln, H. Seigneur, K.O. Davis, Electroluminescence based metrics to assess the impact of cracks on photovoltaic module performance (IEEE, Piscataway, NJ, 2018) [Google Scholar]
- S. Spataru, P. Hacke, D. Sera et al., Quantifying solar cell cracks in photovoltaic modules by electroluminescence imaging, in 2015 IEEE 42nd Photovoltaic Specialist Conference (PVSC) (IEEE, 2015), p. 1 [Google Scholar]
- M. Dhimish, Micro cracks distribution and power degradation of polycrystalline solar cells wafer: Observations constructed from the analysis of 4000 samples, Renew. Energy 145, 466 (2020) [Google Scholar]
- P. Marić, I. Marasović, A. Kuzmanić Skelin et al., Adaptive double-diode modeling for comparative analysis of healthy and microcracked PV modules, Electronics 14, 1559 (2025) [Google Scholar]
- L. Feng, J. Zhang, T.S. Kiong et al., Estimating crack effects on electrical characteristics of PV modules based on monitoring data and I–V curves, IEEE J. Photovolt. 13, 558 (2023) [Google Scholar]
- J. Zhang, Y. Liu, K. Ding et al., Model parameter analysis of cracked photovoltaic module under outdoor conditions, in 2020 IEEE 47th Photovoltaic Specialists Conference (PVSC) (IEEE, 2020), p. 2509 [Google Scholar]
- L.L. Dungs, ITRPV 16, Edition 2025 [Google Scholar]
- A. Hashem, S. Mortazavifar, R. Gottschalg, Impact of modern cell photovoltaic geometries on power and energy loss due to cell cracks, in 41st European Photovoltaic Solar Energy Conference and Exhibition (WIP-Munich, 2024) [Google Scholar]
- M. Mittag, A. Pfreundt, J. Shahid, Impact of solar cell dimensions on module power, efficiency and cell-to-module losses (2020) [Google Scholar]
- M. Dhimish, Y. Hu, Rapid testing on the effect of cracks on solar cells output power performance and thermal operation, Sci. Rep. 12, 12168 (2022) [Google Scholar]
- M. Bdour, Z. Dalala, M. Al-Addous et al., A comprehensive evaluation on types of microcracks and possible effects on power degradation in photovoltaic solar panels, Sustainability 12, 6416 (2020) [Google Scholar]
- M. Köntges, I. Kunze, S. Kajari-Schröder et al., The risk of power loss in crystalline silicon based photovoltaic modules due to micro-cracks, Sol. Energy Mater. Sol. Cells 95, 1131 (2011) [CrossRef] [Google Scholar]
- M. Köntges, I. Kunze, S. Kajari-Schröder, X. Breitenmoser, B. Bjørneklett, Quantifying the risk of power loss in PV modules due to micro cracks (2010) [Google Scholar]
- S. Hassan, M. Dhimish, Broad-scale electroluminescence analysis of 5 million+ photovoltaic cells for defect detection and degradation assessment, Renew. Energy 237, 121868 (2024) [Google Scholar]
- A. Morlier, F. Haase, M. Kontges, Impact of cracks in multicrystalline silicon solar cells on PV module power—A simulation study based on field data, in 2015 IEEE 42nd Photovoltaic Specialist Conference (PVSC) (IEEE, 2015), p. 1 [Google Scholar]
- W. Shockley, The theory of p-n junctions in semiconductors and p-n junction transistors, Bell Syst. Tech. J. 28, 435 (1949) [Google Scholar]
- J.A. Gow and C.D. Manning, Development of a model for photovoltaic arrays suitable for use in simulation studies of solar energy conversion systems, in 1996 Sixth International Conference on Power Electronics and Variable Speed Drives (Conf. Publ. No. 429) (IEEE, 1996), p. 69 [Google Scholar]
- L.M.P. Deotti, I.C. Da Silva, A survey on the parameter extraction problem of the photovoltaic single diode model from a current–voltage curve, Sol. Energy 263, 111930 (2023) [Google Scholar]
- A.M. Humada, M. Hojabri, S. Mekhilef et al., Solar cell parameters extraction based on single and double-diode models: A review, Renew. Sustain. Energy Rev. 56, 494 (2016) [Google Scholar]
- J. Cubas, S. Pindado, M. Victoria, On the analytical approach for modeling photovoltaic systems behavior, J. Power Sources 247, 467 (2014) [Google Scholar]
- M.G. Villalva, J.R. Gazoli, E.R. Filho, Comprehensive approach to modeling and simulation of photovoltaic arrays, IEEE Trans. Power Electron. 24, 1198 (2009) [Google Scholar]
- C.B. Jones, C.W. Hansen, Single diode parameter extraction from in-field photovoltaic I–V curves on a single board computer, in 2019 IEEE 46th Photovoltaic Specialists Conference (PVSC) (IEEE, 2019), p. 87 [Google Scholar]
- J. Kennedy, R. Eberhart, Particle swarm optimization, in Proceedings of ICNN'95—International Conference on Neural Networks (IEEE, 1995), p. 1942 [Google Scholar]
- M. Wolf, H. Rauschenbach, Series resistance effects on solar cell measurments, Adv. Energy Convers. 3, 445 (1963) [Google Scholar]
- G. Goudelis, P.I. Lazaridis, M. Dhimish, A review of models for photovoltaic crack and hotspot prediction, Energies 15, 4303 (2022) [Google Scholar]
- M. Abdelhamid, R. Singh, M. Omar, Review of microcrack detection techniques for silicon solar cells, IEEE J. Photovolt. 4, 514 (2014) [Google Scholar]
- X. Chen, T. Karin, A. Jain, Automated defect identification in electroluminescence images of solar modules, Sol. Energy 242, 20 (2022) [Google Scholar]
- Z. Mahdavipour, Defect inspection of photovoltaic solar modules using aerial electroluminescence (EL): A review, Sol. Energy Mater. Sol. Cells 278, 113210 (2024) [Google Scholar]
- H.R. Parikh, Y. Buratti, S. Spataru et al., Solar cell cracks and finger failure detection using statistical parameters of electroluminescence images and machine learning, Appl. Sci. 10, 8834 (2020) [Google Scholar]
- M. Turek, M. Meusel, Automated classification of electroluminescence images using artificial neural networks in correlation to solar cell performance parameters, Sol. Energy Mater. Sol. Cells 260, 112483 (2023) [Google Scholar]
- T. Dullweber, C. Kranz, R. Peibst, U. Baumann, H. Hannebauer, M. Kutzer, M. Müller, G. Fischer, P. Palinginis, H. Neuhaus, The PERC+ cell: more output power for less aluminium paste, Photovolt. Int. 30, 41 (2015) [Google Scholar]
- P. Saint-Cast, S. Werner, J. Greulich et al., Analysis of the losses of industrial-type PERC solar cells, Phys. Status Solidi A 214, 1600708 (2017) [Google Scholar]
- S. Mack, D. Herrmann, M. Lenes et al., Progress in p-type tunnel oxide-passivated contact solar cells with screen-printed contacts, Sol. RRL 5, 2100152 (2021) [CrossRef] [Google Scholar]
- C. Reichel, F. Feldmann, R. Müller et al., Tunnel oxide passivated contacts formed by ion implantation for applications in silicon solar cells, J. Appl. Phys. 118, 205701 (2015) [Google Scholar]
- V. Benda, Z. Machacek, A note on parameters of photovoltaic cells in dependence on irradiance and temperature, in 7th Mediterranean Conference and Exhibition on Power Generation, Transmission, Distribution and Energy Conversion (IEEE, Piscataway, NJ, 2010), p. 1 [Google Scholar]
- S. Wang, H. Wu, Y. Ge et al., A series resistance extraction method for health evaluation of photovoltaic modules, Front. Energy Res. 12, 1319813 (2024) [Google Scholar]
- C.S. Ruschel, F.P. Gasparin, E.R. Costa et al., Assessment of PV modules shunt resistance dependence on solar irradiance, Sol. Energy 133, 35 (2016) [Google Scholar]
- J. Muller, D. Hinken, S. Blankemeyer et al., Resistive power loss analysis of PV modules made from halved 15.6 × 15.6 cm2 silicon PERC solar cells with efficiencies up to 20.0%, IEEE J. Photovolt. 5, 189 (2015) [Google Scholar]
Cite this article as: Ahmad Hashem, Zonghan Jiang, Guido Willers, Leila Mortazavifar, Bengt Jaeckel, Ralph Gottschalg, Impact of cell cracks on performance of PV modules with current cell technologies, EPJ Photovoltaics 17, 25 (2026), https://doi.org/10.1051/epjpv/2026017
Appendix
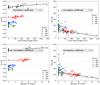 |
Fig. A1 Rs, Rsh correlation with crack characteristics for PERC Modules (200 W/m2). |
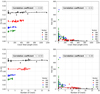 |
Fig. A2 Rs, Rsh correlation with crack characteristics for PERC Modules (1000 W/m2). |
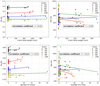 |
Fig. A3 Rs, Rsh correlation with crack characteristics for TopCon Modules (200 W/m2). |
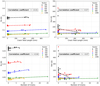 |
Fig. A4 Rs, Rsh correlation with crack characteristics for TopCon Modules (1000 W/m2). |
All Tables
All Figures
|
Fig. 1 Single-diode model electrical circuit. |
| In the text | |
|
Fig. 2 Crack detection workflow. |
| In the text | |
|
Fig. 3 Crack detection results for TOPCon (right) and PERC (left). |
| In the text | |
|
Fig. 4 Uncertainty measurements of key points extraction. |
| In the text | |
|
Fig. 5 Rs and Rsh values for crack-free modules. |
| In the text | |
|
Fig. 6 Scatter plots of Pmpp versus crack total length (a) and number of cracks (b) for PERC modules alongside with the mean correlation coefficient. |
| In the text | |
|
Fig. 7 Scatter plots of Pmpp versus crack total length (a) and number of cracks (b) for TopCon modules alongside with the mean correlation coefficient. |
| In the text | |
|
Fig. 8 Mean correlation heat-map across the pooled dataset. |
| In the text | |
|
Fig. A1 Rs, Rsh correlation with crack characteristics for PERC Modules (200 W/m2). |
| In the text | |
|
Fig. A2 Rs, Rsh correlation with crack characteristics for PERC Modules (1000 W/m2). |
| In the text | |
|
Fig. A3 Rs, Rsh correlation with crack characteristics for TopCon Modules (200 W/m2). |
| In the text | |
|
Fig. A4 Rs, Rsh correlation with crack characteristics for TopCon Modules (1000 W/m2). |
| In the text | |
Current usage metrics show cumulative count of Article Views (full-text article views including HTML views, PDF and ePub downloads, according to the available data) and Abstracts Views on Vision4Press platform.
Data correspond to usage on the plateform after 2015. The current usage metrics is available 48-96 hours after online publication and is updated daily on week days.
Initial download of the metrics may take a while.