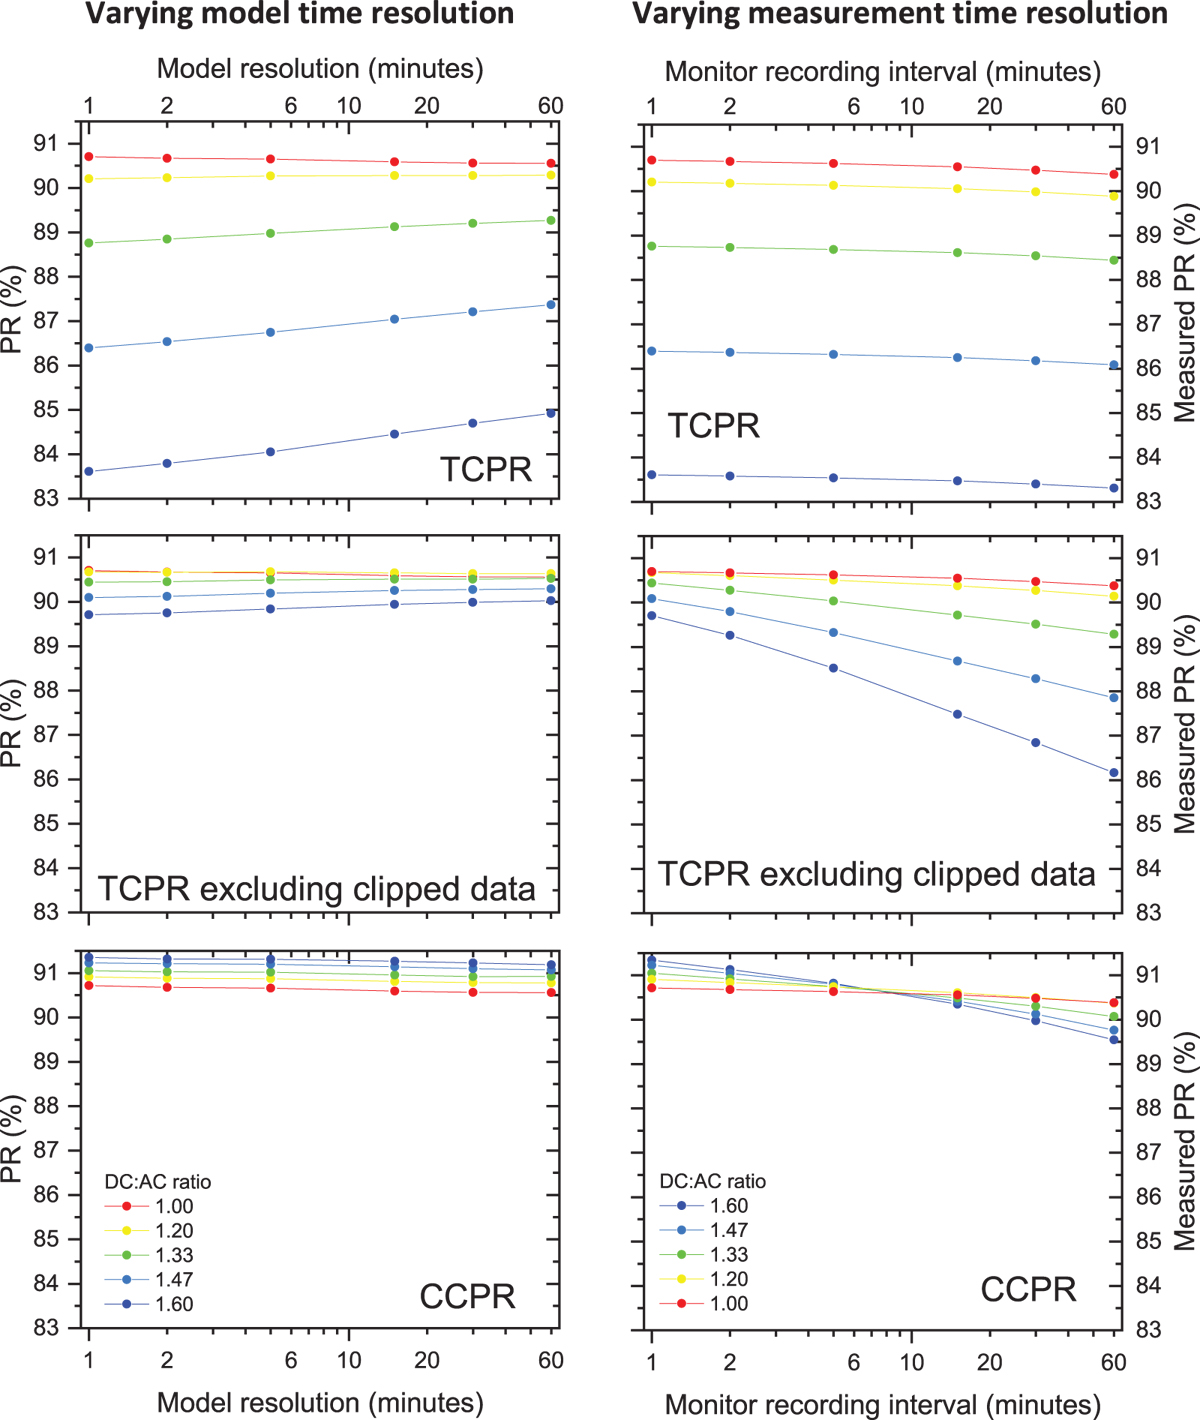
Fig. 7
Download original image
Left: Variation of modelled PR with model time resolution based on aggregation of 1 min resolution weather data into longer time intervals. Right: Variation of measured PR with measurement time resolution based on simulating the effect of aggregating 1 min resolution sensor and system outputs into longer time intervals. PR metrics are averaged over 6 BSRN locations for the default monofacial fixed-tilt system. Different colors represent different DC:AC ratios.
Current usage metrics show cumulative count of Article Views (full-text article views including HTML views, PDF and ePub downloads, according to the available data) and Abstracts Views on Vision4Press platform.
Data correspond to usage on the plateform after 2015. The current usage metrics is available 48-96 hours after online publication and is updated daily on week days.
Initial download of the metrics may take a while.