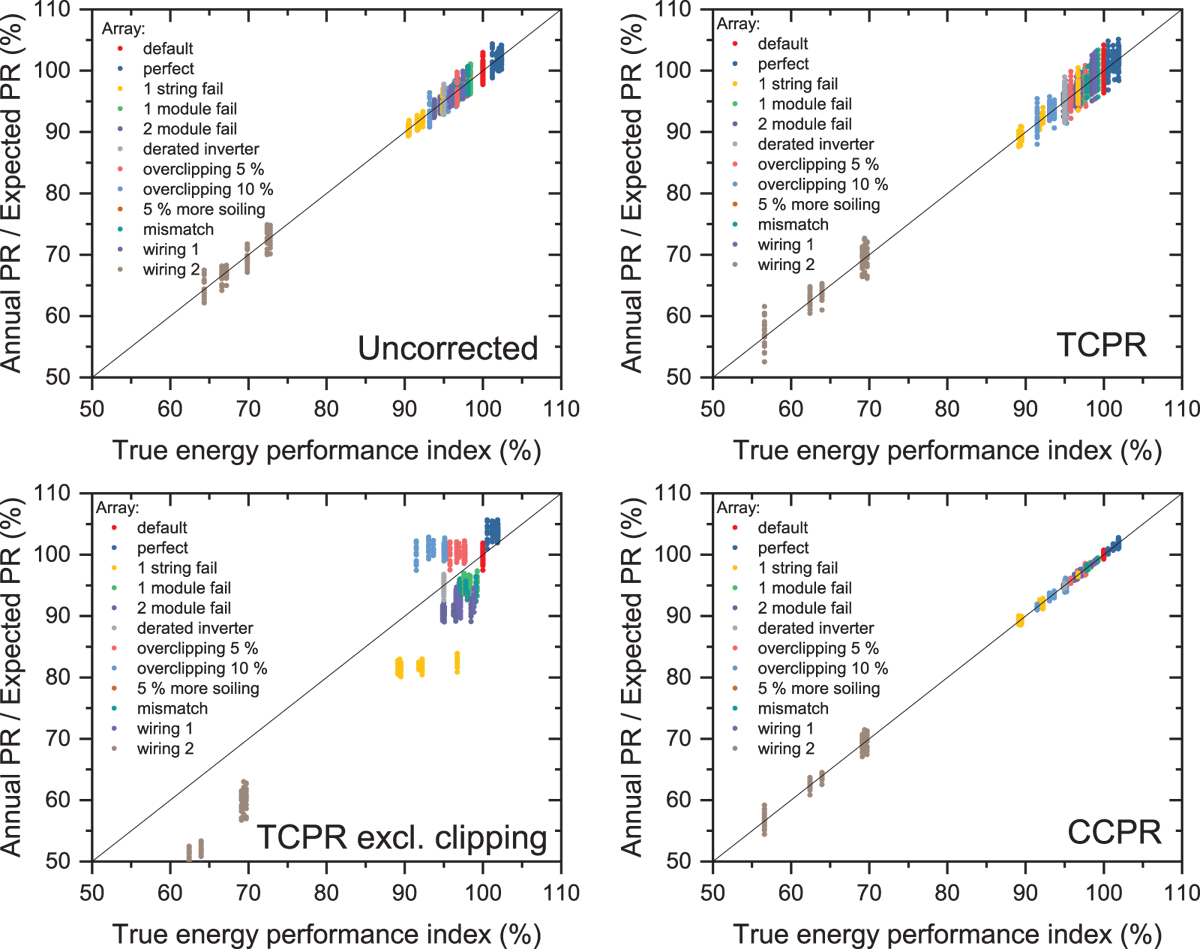
Fig. 6
Download original image
Scatter plot of ratio of annual / expected PR versus true performance index for abnormally performing monofacial fixed-tilt arrays simulated in six different locations. Each figure shows a different variant of PR metric. Each point shows results from 1 yr at one location. Different point colors indicate arrays with different performance issues. The default array is an array that performs exactly as expected. All arrays have a DC:AC ratio of 1.6.
Current usage metrics show cumulative count of Article Views (full-text article views including HTML views, PDF and ePub downloads, according to the available data) and Abstracts Views on Vision4Press platform.
Data correspond to usage on the plateform after 2015. The current usage metrics is available 48-96 hours after online publication and is updated daily on week days.
Initial download of the metrics may take a while.