Fig. 4
Download original image
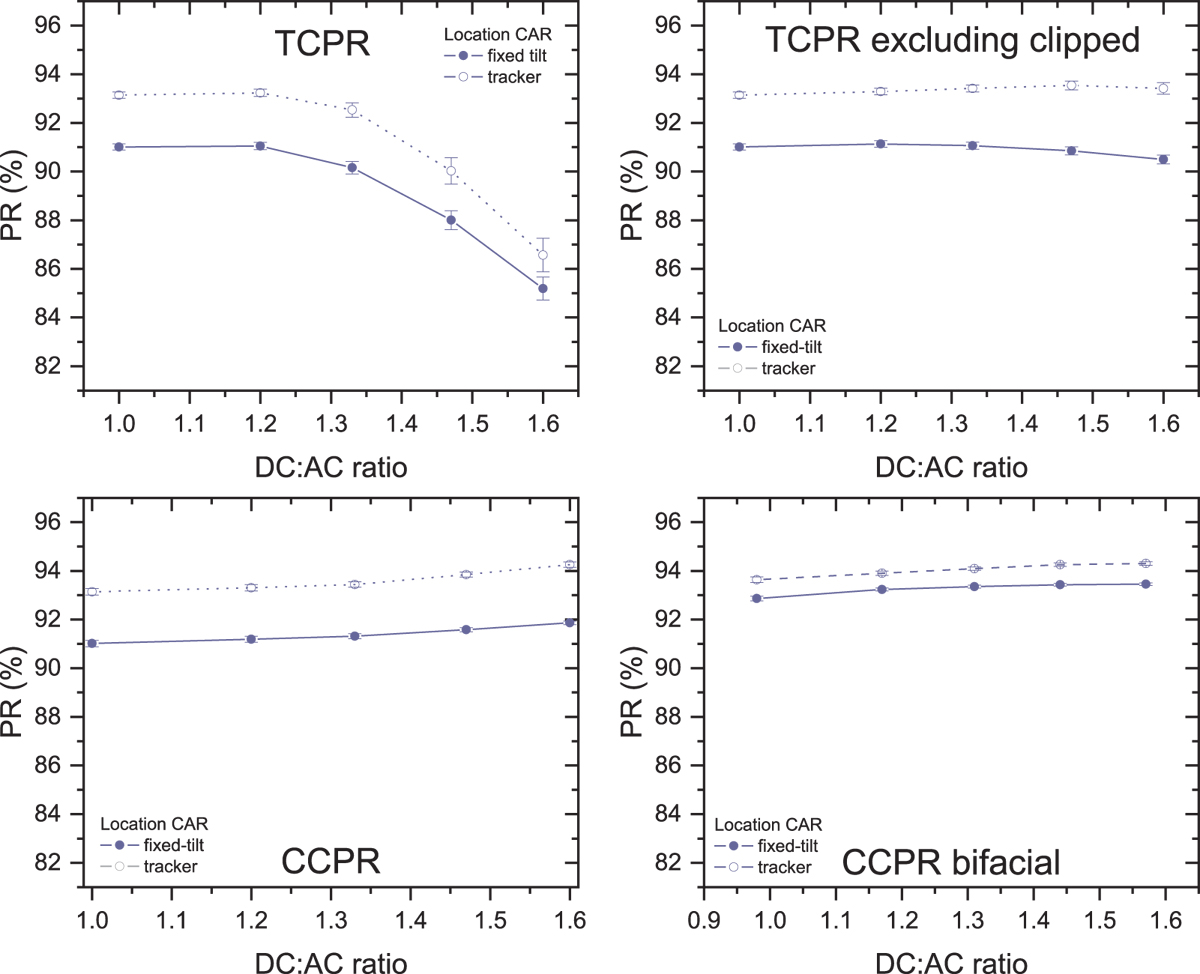
Average (symbols) and standard deviation (error bars) of annual PR values determined for nominally performing (default) arrays as a function of DC:AC ratio for the default array in one location. Results for other locations are shown in the Supporting Information. Solid lines are fixed-tilt systems and dashed lines for single-axis trackers. Top-left: Temperature corrected PR on monofacial arrays. Top-right: The same but excluding datapoints where clipping occurs. Bottom-left: Clipping corrected PR on monofacial arrays. Bottom-right: Clipping corrected bifacial PR on bifacial arrays.
Current usage metrics show cumulative count of Article Views (full-text article views including HTML views, PDF and ePub downloads, according to the available data) and Abstracts Views on Vision4Press platform.
Data correspond to usage on the plateform after 2015. The current usage metrics is available 48-96 hours after online publication and is updated daily on week days.
Initial download of the metrics may take a while.