Fig. 7
Download original image
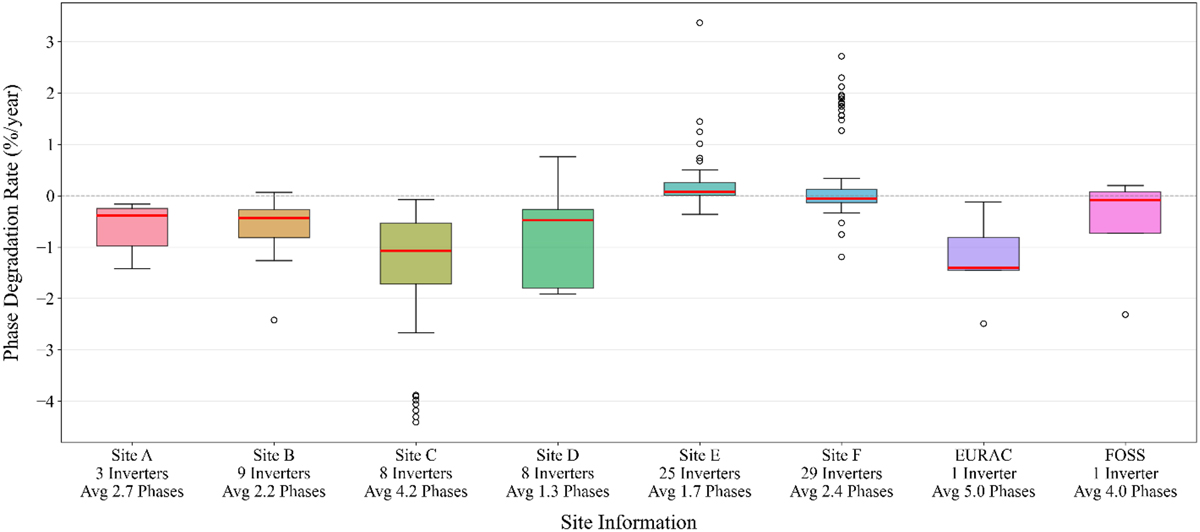
Distribution of phase-specific degradation rates obtained from the proposed framework across eight PV sites. Each boxplot summarizes the slopes of all piecewise linear segments identified for all inverters at a given site, illustrating the variability in degradation behavior across phases and system locations. Site labels include the number of inverters analyzed and the average number of detected phases per inverter.
Current usage metrics show cumulative count of Article Views (full-text article views including HTML views, PDF and ePub downloads, according to the available data) and Abstracts Views on Vision4Press platform.
Data correspond to usage on the plateform after 2015. The current usage metrics is available 48-96 hours after online publication and is updated daily on week days.
Initial download of the metrics may take a while.