Fig. 5
Download original image
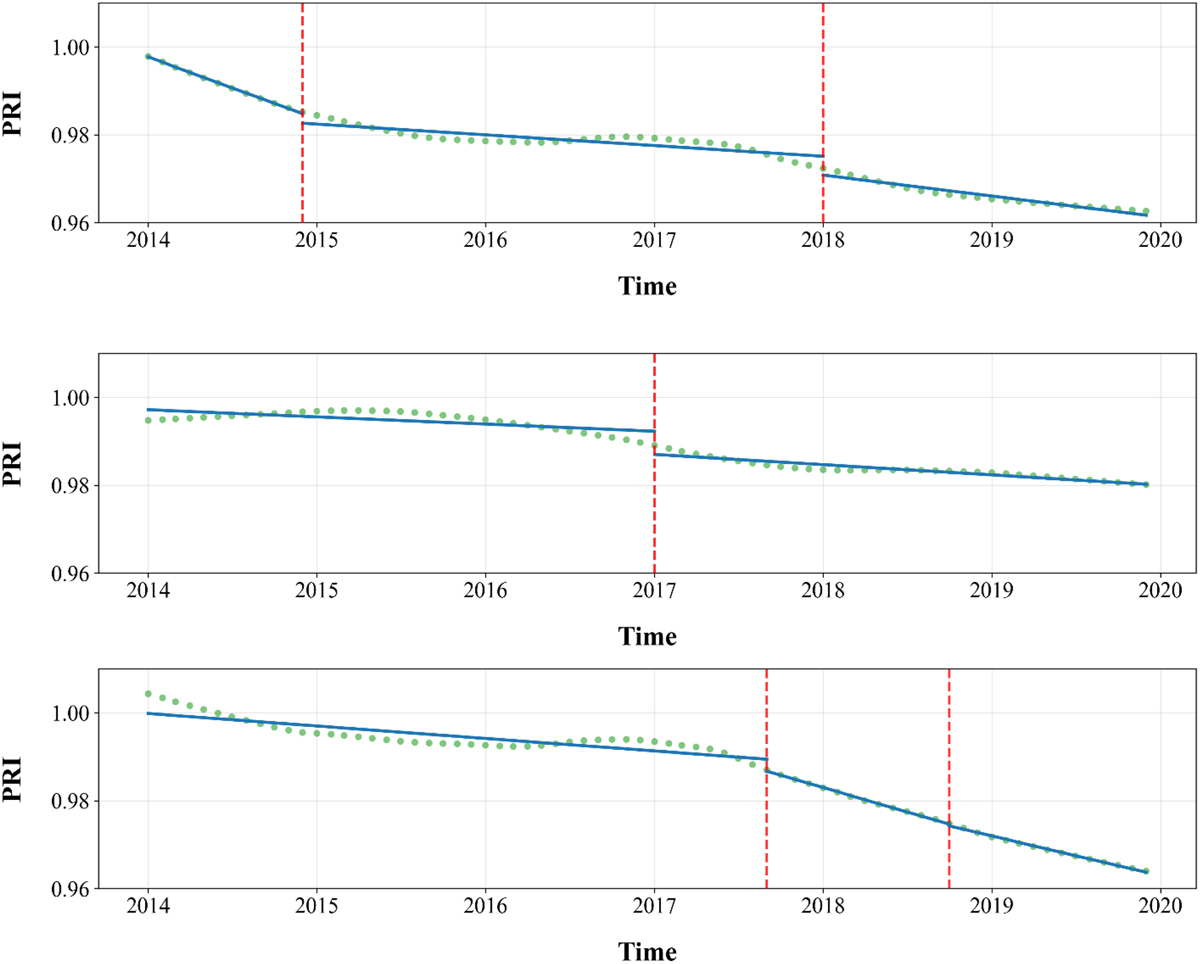
Piecewise linear regression of the extracted PRI degradation trends for the three inverters at Site A. For each inverter, the monthly PRI values (green markers) are shown together with the corresponding piecewise linear best-fit model (blue line). Vertical red dashed lines denote change points detected by the PELT algorithm, partitioning the trend into distinct operational degradation phases.
Current usage metrics show cumulative count of Article Views (full-text article views including HTML views, PDF and ePub downloads, according to the available data) and Abstracts Views on Vision4Press platform.
Data correspond to usage on the plateform after 2015. The current usage metrics is available 48-96 hours after online publication and is updated daily on week days.
Initial download of the metrics may take a while.