Fig. 2
Download original image
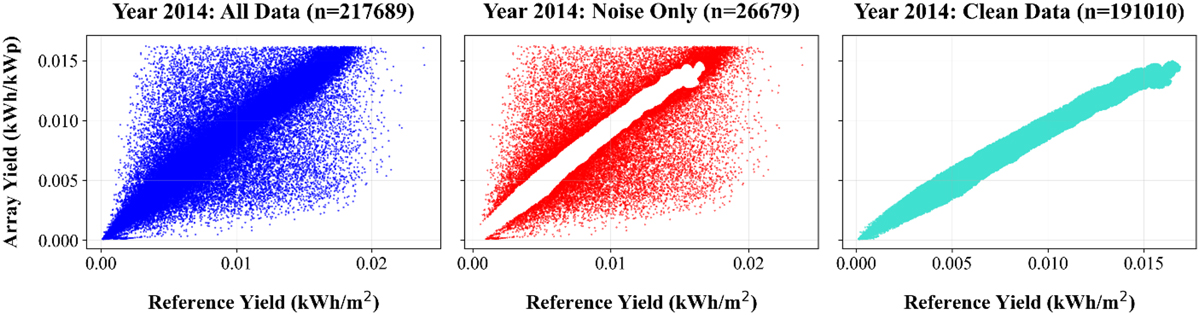
Visualization of the DBSCAN filtering process on the 2014 dataset. Left: The unfiltered relationship between array yield and reference yield, visualized with high point transparency. The overlapping data points reveal a dense, linear trend corresponding to the system's primary operational mode, but it is surrounded by significant noise. Middle: The anomalous data points identified as noise by the DBSCAN algorithm. These outliers, which constitute only around 12% of the total data, are removed from the analysis. Right: The clean, high-density cluster retained after filtering. This cluster, comprising approximately 87% of the original data. Given the consistency, we present the results for a single representative inverter (Inverter 2001). The filtering results for the other two inverters, which show nearly identical patterns, are provided in Appendix A (Figs. A1–A3).
Current usage metrics show cumulative count of Article Views (full-text article views including HTML views, PDF and ePub downloads, according to the available data) and Abstracts Views on Vision4Press platform.
Data correspond to usage on the plateform after 2015. The current usage metrics is available 48-96 hours after online publication and is updated daily on week days.
Initial download of the metrics may take a while.