Fig. 5
Download original image
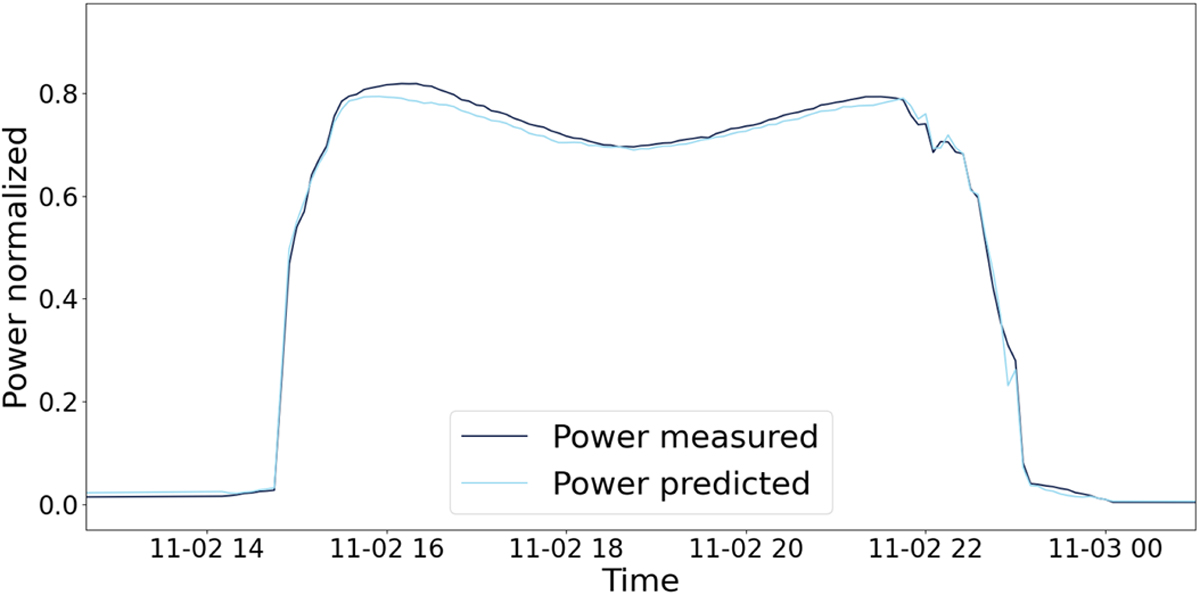
An example of a PV plant overperforming. The measured power output is represented by the blue data points, while the light blue points denote the power values predicted by the model. In this depiction, the observed measured power consistently surpasses the corresponding predicted values. This discrepancy between the actual and predicted power output underscores the over performance of the PV plant relative to the expectations derived from the model and its neighbouring systems.
Current usage metrics show cumulative count of Article Views (full-text article views including HTML views, PDF and ePub downloads, according to the available data) and Abstracts Views on Vision4Press platform.
Data correspond to usage on the plateform after 2015. The current usage metrics is available 48-96 hours after online publication and is updated daily on week days.
Initial download of the metrics may take a while.