Fig. 2
Download original image
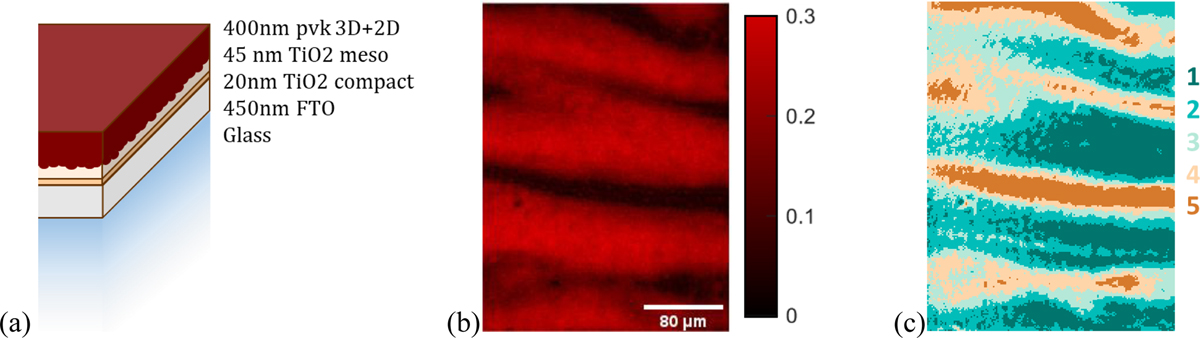
(a) Structure of the perovskite stack under study, which is illuminated from the perovskite side. (b) Image of reflection of white light illumination onto the sample at 1.53 eV. (c) Areas of interest determined by clustering from the reflection.
Current usage metrics show cumulative count of Article Views (full-text article views including HTML views, PDF and ePub downloads, according to the available data) and Abstracts Views on Vision4Press platform.
Data correspond to usage on the plateform after 2015. The current usage metrics is available 48-96 hours after online publication and is updated daily on week days.
Initial download of the metrics may take a while.