| Issue |
EPJ Photovolt.
Volume 17, 2026
Special Issue on ‘EU PVSEC 2025: State of the Art and Developments in Photovoltaics', edited by Robert Kenny and Carlos del Cañizo
|
|
|---|---|---|
| Article Number | 20 | |
| Number of page(s) | 15 | |
| DOI | https://doi.org/10.1051/epjpv/2026012 | |
| Published online | 08 May 2026 | |
https://doi.org/10.1051/epjpv/2026012
Original Article
Enhanced value of grid-connected PV with battery storage in a negative price environment
Belectric Holding GmbH, Wadenbrunner Str. 10, City 97509, Germany
* e-mail: This email address is being protected from spambots. You need JavaScript enabled to view it.
Received:
19
September
2025
Accepted:
16
March
2026
Published online: 8 May 2026
Abstract
In recent years, global PV capacity – particularly in the EU – has reached record levels, supporting decarbonization goals but also intensifying market effects such as increasingly frequent negative electricity prices driven by oversupply and limited system flexibility. These conditions pose growing economic challenges for utility-scale PV assets. This study examines the impact of negative price hours on PV performance and assesses the role of battery energy storage systems (BESS) in mitigating these effects, using Germany as a case study. A temporal analysis identifies pronounced seasonal and diurnal patterns, with negative prices peaking in spring and around midday. Under high negative electricity price scenarios, PV systems experience curtailment-related energy losses of up to 10%, while BESS output increases through active participation in day-ahead and intraday markets. Contrary to common assumptions, increasing BESS capacity does not significantly reduce PV curtailment or enhance PV-specific value. Instead, while total system revenues (PV – BESS) rise monotonically with storage size, the gains are driven entirely by BESS revenues. Economically, standalone PV systems exhibit substantial value erosion, whereas hybrid PV-BESS configurations demonstrate greater resilience and higher net present value (NPV) across all scenarios. These findings underscore that the primary value of storage lies in market-based revenue generation rather than curtailment mitigation, highlighting the strategic importance of storage-ready PV designs, either integrated at deployment or retrofitted to preserve asset value in increasingly volatile electricity markets.
Key words: Photovoltaic systems / negative electricity prices / battery energy storage systems / energy curtailment / economic valuation / grid flexibility / hybrid energy systems
© D. Berrian et al., Published by EDP Sciences, 2026
 This is an Open Access article distributed under the terms of the Creative Commons Attribution License (https://creativecommons.org/licenses/by/4.0), which permits unrestricted use, distribution, and reproduction in any medium, provided the original work is properly cited.
1 Introduction
The deployment rate of photovoltaic (PV) systems has accelerated significantly in recent years compared to previous decades. For instance, an additional 1 terawatt (TW) of installed PV capacity was added between 2022 and 2024, bringing the global total installed PV capacity to 2 TW. However, this rapid growth has also led to some challenges, particularly for grid-connected PV systems. The number of hours with negative electricity prices has surged, reaching unprecedented levels of 457 hours in Germany and over 500 hours in Nordic countries [1]. Consequently, PV assets are being devalued and are becoming less attractive investments, as PV production often needs to be curtailed during these negative price periods. This study investigates methods to increase the value of PV systems by integrating them with battery energy storage systems (BESS), thereby enhancing their resilience against negative prices. Utilizing current price curves, we examine two market scenarios: low and high negative price environments. Additionally, we assess the value of PV systems and the benefits of co-locating PV with BESS under these conditions.
The European electricity markets are experiencing a notable rise in the frequency and duration of negative electricity prices [2,3]. Once a rare occurrence, negative pricing has become a more regular feature, particularly in regions with high penetration of weather-dependent renewables like Spain and Finland [4]. The phenomenon of negative electricity hours arises when the supply of electricity, often dominated by renewable sources during favorable weather conditions, exceeds the demand [5,6]. Factors such as inflexible conventional power generation that cannot quickly reduce output and, in some cases, renewable energy subsidies that incentivize continued production regardless of demand, further contribute to this oversupply. Grid congestion and limited interconnection capacity in certain regions also exacerbate the issue by hindering the export of excess power [7,8].
BESS represent a key technology for addressing the challenges posed by negative electricity prices and the intermittency of renewable energy sources [9,10]. Various BESS technologies exist, including lithium-ion, lead-acid, and flow batteries [11,12]. Lithium-ion batteries have emerged as a dominant technology for grid-scale applications due to their high energy density, relatively long lifespan, and decreasing costs [13]. BESS can be applied in grid-connected systems for a variety of purposes, such as providing frequency regulation services, peak shaving (reducing peak electricity demand), energy arbitrage (buying electricity when prices are low and selling when high), and facilitating the integration of renewable energy by storing excess generation [14,15]. Combining BESS with solar PV offers numerous benefits, including increased self-consumption of generated solar energy, the provision of backup power during outages, and enhanced support for grid stability [16,17]. Two main approaches exist for retrofitting BESS: AC-coupled and DC-coupled systems. AC-coupled systems connect the battery storage to the AC side of the PV system, often using a separate battery inverter [18,19]. This method is generally simpler and more cost-effective for retrofits as it typically does not require changes to the existing solar inverter [18]. However, it involves additional energy conversion steps, which can lead to some efficiency losses. DC-coupled systems, on the other hand, connect the battery storage directly to the DC side of the PV system, usually requiring the replacement of the existing solar inverter with a hybrid inverter [20]. While DC-coupling offers higher efficiency due to fewer energy conversions, it can be more complex and expensive to implement as a retrofit [18]. Additionally, DC-coupled hybrid systems may be limited in the number of markets they can participate in. Accordingly, this study assumes an AC-coupled energy storage system utilizing lithium-ion battery technology, and this assumption is applied consistently throughout the paper.
Numerous studies have examined the integration of photovoltaic systems with battery energy storage as a strategy to mitigate curtailment and enhance economic returns in the context of fluctuating or negative electricity prices. For example, Zhang et al. [21] developed an optimization model to determine the optimal size and operation of BESS co-located with PV under time-of-use pricing schemes, showing improved self-consumption and economic performance. Atherton et al [22] conducted a comprehensive techno-economic analysis of energy storage co-located with wind farms in Great Britain. Their study assessed 47 sites and demonstrated that BESS can improve economic returns through energy arbitrage and reduce wind curtailment. Semmelmann et al [23] conducted an in-depth analysis of the profitability of stationary battery storage systems engaged in day-ahead electricity trading within the Germany/Luxembourg market. Their study incorporated key factors such as price uncertainty, battery degradation over time, and evolving market conditions between 2020 and 2022. By simulating real market price scenarios and accounting for the wear and efficiency losses of lithium-ion batteries, the research demonstrated that while energy arbitrage remains a promising revenue stream, the long-term economic viability of BESS is highly sensitive to market volatility and degradation rates. The findings emphasize the importance of incorporating realistic operational constraints and future market dynamics in techno-economic assessments of battery storage investments. Meanwhile, Gailani et al [24] investigated recent policy reforms across EU markets-including Germany-with high renewable integration, showing that regulations around double network charges, grid access, and the definition of storage significantly influence the viability of BESS systems. However, like many region-specific studies, this work primarily analyzes existing regulatory environments and market conditions rather than stress-testing BESS under future scenarios of extreme price volatility or deep negative pricing events.
In contrast to previous studies, this paper focuses on evaluating the economic value of PV-BESS systems under two distinct forward-looking market scenarios: low and high negative price environments, using recently updated electricity price forecasts for the period 2026–2055 [25]. Moreover, instead of examining arbitrage in isolation, our study considers both arbitrage and curtailment mitigation along with ancillary services as multiple value streams, enabling a more comprehensive evaluation of co-location benefits. We also assess the energy storage in combination with solar trackers and highlight sensitivity to future price structures, a gap not thoroughly addressed in earlier work. By focusing on real-world data from regions experiencing the fastest growth in negative prices, like Germany, this study offers practical insights for developers, investors, and policymakers considering PV-BESS investments in evolving electricity markets. This study centers on Germany as the geographical framework for the analysis. The paper is structured as follows: Section 2 details the modeling approach, including a concise overview of relevant electricity markets. Section 3 investigates historical trends in negative electricity prices and evaluates how future price curves – characterized by either persistently low or highly negative prices – may impact the performance and economic viability of BESS and PV generation. Finally, Section 4 summarizes the key findings and main conclusions of the study.
2 Methodology and key materials
2.1 Key electricity markets modeled for BESS participation
Front-of-the-meter BESS can participate in several electricity markets, each with distinct operational roles and pricing mechanisms. In the Day-Ahead (DA) market, which typically operates on a pay-as-clear basis, BESS operators submit bids to buy and sell electricity for the following day, enabling energy arbitrage by charging during low-price periods - often aligned with high renewable output - and discharging when prices are high. This strategy is increasingly profitable due to growing price volatility and the occurrence of negative prices driven by renewable oversupply. More details about the day-ahead marketing mechanism are described in [26,27]. The Intraday market in Germany allows continuous trading of electricity up to 5 minutes before delivery, enabling real-time adjustments to day-ahead schedules based on updated forecasts for price, PV generation, and battery state-of-charge, it consists of continuous trading, which follows a pay-as-bid pricing mechanism, and quarterly intraday auctions, which operate on a pay-as-clear basis [28,29]. BESS operators can leverage this market to exploit price volatility, monetize forecast errors, and re-optimize dispatch while balancing reserve obligations. Intraday trading thus plays a crucial role in enhancing system flexibility and profitability under uncertainty. The Frequency Containment Reserve (FCR) market, which is generally pay-as-clear, requires an immediate response to frequency deviations within seconds, making BESS ideal due to their fast and accurate power modulation, which supports grid stability and provides a relatively stable revenue stream; however, increasing competition may reduce returns, the description of market requirements and prequalification can be found in [30,31]. The Automatic Frequency Restoration Reserve (aFRR) market, which encompasses both capacity and energy components, generally operates on a pay-as-bid basis. In the aFRR capacity market, BESS are remunerated for their availability to respond to activation signals, requiring strategic bidding and careful allocation of capacity across competing revenue streams. In the aFRR energy market, BESS are paid based on the actual energy delivered in response to real-time grid needs, with compensation determined by the bid price, introducing operational uncertainty and necessitating detailed modeling of state-of-charge, efficiency, and dispatch behavior. Marieke et.al researched the aFRR, including the market description and participation requirements [32]. Together, these markets offer BESS operators multiple revenue streams while enabling greater grid flexibility and renewable integration.
2.2 Existing front-of-the-meter BESS optimization tools
There are several commercially available and specialized tools for standalone and hybrid front-of-the meter BESS optimization, depending on markets, that offer pre-built functionalities tailored for modeling BESS operation and participation in electricity markets. These include platforms like HOMER Energy, which is well-known for its microgrid modeling capabilities and features for simulating battery storage dispatch strategies that consider various market participation options [33]. Emulate Energy’s platform and Fractal Model also provide dedicated solutions for simplifying the connection of BESS to energy markets, offering proprietary control algorithms for multi-market participation and tools for financial modeling and project lifecycle analysis [34]. In addition to this, several newer and specialized platforms have gained traction. Chronos by Aurora Energy Research offers advanced modeling of BESS revenue streams across multiple European electricity markets, with a focus on long-term scenario analysis and policy impacts [25]. Cosmos from Clean Horizon provides a comprehensive interface for simulating BESS participation in ancillary services and capacity markets, particularly in the European context [35,36]. Modo by Modo Energy, very well known for the UK market, delivers real-time and historical market data analytics, enabling users to benchmark BESS performance and revenue across different market segments [6]. EnerStorage Pro from enervis supports comprehensive techno-economic modeling of BESS projects, including detailed simulations of market participation strategies, revenue stacking, and sensitivity analyses [37]. A summary of the aforementioned tools, including their capabilities and market coverage is provided in the annex under Table A.4. While the tools reviewed exhibit overlapping capabilities, they differ significantly in terms of functional depth, market compatibility, user interface, and total cost of ownership. Following a comprehensive evaluation based on this study requirements, COSMOS was chosen as the most suitable solution for BESS optimization. Its advanced modeling capabilities, adaptability to European market conditions, and transparent cost structure aligned closely with our project objectives. The subsequent sections provide a description of COSMOS’s features and its application within our optimization framework.
2.3 COSMOS tool
Existing front-of-the-meter BESS optimization tools Cosmos operates through a structured workflow that begins with a comprehensive set of inputs and culminates in optimized sub-hourly dispatch decisions [35]. A diagram summarizing the simulation flow from inputs to outputs is shown in Figure 1. The first stage involves collecting a wide range of technical and market inputs. These include electricity price forecasts across multiple timeframes (day-ahead, intraday, and ancillary services), as well as market design parameters such as dispatch intervals, remuneration mechanisms (e.g., pay-as-clear vs. pay-per-bid), and service-specific constraints. Technical limitations are also incorporated, including the size of the grid connection (in MW) and minimum and maximum state-of-charge (SOC) thresholds required for the BESS to participate in various services. The model also integrates detailed descriptions of the physical assets. For the PV system, inputs include the installed capacity, an annual degradation profile, and an hourly generation profile over a full year. For the BESS, specifications include rated power (MW), energy capacity (hours), daily cycling limits, round-trip efficiency, a representative cycling profile, and degradation behavior as a function of years, which is often provided by battery suppliers. Cosmos is made based on certain assumptions that are summarized below.
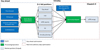 |
Fig. 1 A visual representation illustrating the required inputs, optimization processes, and expected outputs of the COSMOS dispatch framework for front-of-the-meter BESS operation in multi-market environments. |
Assumptions
Perfect foresight for d-1 markets such as the day-ahead wholesale market, FCR, and aFRR reservation market.
Imperfect foresight for real-time energy prices: it places bids on d-1 market without perfect foresight for the next day’s real-time energy market prices (aFRR energy and Intraday). Which means the model uses historical price patterns instead of forecast price curves.
If the asset bid price is below the market-clearing price, it may not be fully activated during the entire 15-minutes timeslot. In this case, the probability of energy activation is assumed 50%.
PV generation was given priority over BESS for feeding electricity into the grid.
At the core of Cosmos lies an optimization engine that employs mathematical programming techniques, particularly Linear Programming (LP) and Mixed-Integer Linear Programming (MILP) to determine optimal scheduling strategies. These models are widely used in DA market to maximize revenue from energy arbitrage [38]. By framing the BESS operation as an optimization problem, the model can simultaneously consider multiple constraints, such as the battery’s energy capacity, power limits, charge/discharge efficiencies, and DA market rules, to generate the most profitable operational plan [39]. Forecasted day-ahead electricity prices serve as a key input to the optimization algorithm, enabling it to determine the ideal charge and discharge patterns that exploit price differentials. The quality of these price forecasts is crucial: inaccurate predictions may lead to suboptimal scheduling and reduced economic performance [39]. The flexibility of the MILP formulation also allows integration of operational decisions related to participation in ancillary service markets.
In addition, Cosmos supports value stacking, which is increasingly becoming standard practice in BESS trading strategies. Value stacking models represent a sophisticated approach to simulating the operation of BESS by considering their participation in multiple electricity markets, either simultaneously or sequentially. For instance, a BESS might engage in energy arbitrage in the day-ahead market while also providing ancillary services such as FCR, aFRR for frequency regulation and reserve capacity [40,41]. This approach significantly enhances the total revenue potential of a storage asset by leveraging its operational flexibility to capture value across services and timeframes. These models must carefully account for technical constraints, particularly the trade-offs between using stored energy for arbitrage and reserving capacity for ancillary services. Therefore, the model incorporates dynamic control and scheduling logic to allocate the battery’s energy and power capacity in real time, depending on prevailing market signals and contractual obligations. For example, a BESS that is contracted to provide FCR must maintain a certain amount of headroom (available charging capacity) and footroom (available discharging capacity), which may restrict its ability to perform full-scale arbitrage during the same period.
On the day of operation, the model dynamically adjusts the day-ahead schedule using updated intraday data, including revised PV forecasts and real-time price signals from the past 30 days. A sub-hourly dispatch module then governs real-time operational control, directing energy flows between the PV array, BESS, and the grid. This final stage ensures compliance with market commitments and technical constraints while maximizing short-term value capture. The output includes activated balancing energy (aFRR), actual energy market transactions, and detailed operational logs for each asset, thereby ensuring traceability and performance verification.
2.4 Key performance indicators
The net present value (NPV) is chosen as the main metric to assess the economic performance of the different scenarios studied in this work. This metric is widely recognized for evaluating the investment profitability of PV systems. NPV is not a relative measure; it represents the absolute value - expressed in today’s money - that an investment can generate. It takes into account both the scale of the project and its impact on overall returns. In this study, NPV will be used for both PV and BESS systems and is defined as follows:
 (1)
(1)
CAPEX: Initial capital expenditure; Rt: Revenue or savings in year t; OPEX0: Base year operating cost; i: Annual inflation rate for OPEX; r: Discount rate; T: Project lifetime.
The Net Present Value (NPV) is a comprehensive metric that accounts for both the initial capital investment (CAPEX) and the future operational and maintenance costs (OPEX), alongside the annual cash flows (Rt) generated by the system. All future cash flows are discounted to their present value using a discount rate (r), reflecting the time value of money. In the context of PV and BESS projects, it is common practice to assume that OPEX increases over time due to inflation, represented by an annual inflation rate (i). This inflation is explicitly considered in the NPV calculation.
The NPV is computed annually, starting from the year of project commissioning and continuing through the assumed project lifetime of 30 yr for PV systems and 15 yr for BESS. This approach ensures that both the economic scale and temporal dynamics of the investment are accurately captured.
The Internal Rate of Return (IRR) complements NPV by providing a relative measure of profitability. It represents the discount rate at which the NPV equals zero. In practice, the same NPV formula in equation (1) will be used to solve for the IRR by finding the rate ‘r’ that makes the expression equal to zero. Higher IRR values indicate more attractive PV and BESS investments.
The Discounted Payback Period (DPP) in equation (2) indicates how many years are needed for a project to recover its initial investment based on the present value of cash flows. A project reaches its DPP when cumulative discounted cash flows equal the initial capital cost. This KPI is commonly used to assess investment risk- especially for PV and BESS projects - with shorter DPP values indicating lower risk and greater attractiveness. The DPP is calculated as follows:
 (2)
(2)
DCFy: Discounted cash flow in year y; CumDCFy-1: Cumulative discounted cash flow up to year (y - 1); DPP: Discounted payback period is the year (y) when cumulative discounted cash flows equal the initial invested capital cost.
3 Results and discussion
3.1 Trends in negative electricity prices in Germany
To investigate how negative electricity prices evolved in the German market, we retrieved day-ahead price data from the open-access platform smard.de. Smard.de is operated by the German Federal Network Agency and provides detailed, high-resolution data on electricity markets, including generation, consumption, and pricing. While its primary focus is on Germany, the platform also offers insights into several other European electricity markets. The dataset used spans from January 1st, 2018, to December 31st, 2024, with an hourly resolution.
Figure 2 presents a bar plot showing the yearly count of hours with negative electricity prices in Germany over this period. In 2018, negative price hours were relatively rare, totaling only 27. However, in 2019, this number surged to 211, marking an almost eightfold increase. The trend continued upward, peaking at 298 in 2020, before dipping in 2021 and 2022 to 139 and 69 hours respectively. A sharp rebound occurred in 2023 with 301 negative hours, culminating in a record 457 hours in 2024. This fluctuation highlights the dynamic nature of the German electricity market and the increasing frequency of conditions leading to negative pricing. The dip in the frequency of negative electricity price hours during 2021 and 2022 can be attributed to a combination of market recovery and geopolitical disruptions. These years followed the COVID-19 lockdown period, during which electricity demand had significantly dropped. As economic activity resumed, electricity demand rebounded, reducing the likelihood of oversupply situations that typically lead to negative prices. Additionally, the disruption of natural gas supply chains due to the Russia-Ukraine war led to increased reliance on alternative energy sources, including renewables. However, the overall market volatility and high energy prices during this period may have discouraged overproduction, contributing to the temporary decline in negative price events.
Plotting the monthly distribution of negative electricity price hours from 2018 to 2024, as illustrated in Figure 3, reveals a clear seasonal pattern. The majority of negative price hours occur during the spring months, with a pronounced peak in May. In contrast, the lowest counts are consistently observed during the winter season, particularly between November and January. This trend suggests that seasonal factors - such as increased renewable generation in spring and higher demand in winter - play a significant role in shaping the occurrence of negative electricity prices in Germany.
The plot also highlights the variability in the frequency of negative hours across months. Spring and summer months exhibit greater variability, likely due to weather fluctuations that impact renewable energy production, especially solar and wind. In contrast, winter months show more stability, as indicated by narrower box plots. This could be attributed to steadier demand, more predictable weather conditions, and lower solar generation, which collectively reduce the likelihood of oversupply and negative pricing. Except December stands out with a relatively high average count of negative price hours; however, both variability and overall frequency remain lower than in May. A plausible explanation is supply-demand imbalances combined with limited system flexibility. Strong wind generation and reduced demand - partly due to lower industrial activity during the holiday period - likely contribute to these occurrences. This remains a hypothesis and requires further validation.
Figure 4 illustrates the distribution of negative hourly electricity prices in Germany across the 24-hour day, aggregated over the years 2018 to 2024. The box plots represent the spread and variability of negative price occurrences for each hour, while the blue line traces the mean count of negative price hours. The data reveals a distinct diurnal pattern. The frequency of negative electricity prices begins to rise in the early morning hours, gradually increasing until it peaks around 14:00 (2 PM). This midday peak aligns with periods of high solar generation and relatively low demand, particularly during weekends or holidays, leading to oversupply and thus negative pricing. After 2 PM, the frequency of negative prices declines steadily, reaching minimal levels between 18:00 and 23:00. This evening period typically corresponds to higher electricity demand and reduced solar generation, which stabilizes prices and reduces the likelihood of negative values. From midnight to early morning (00:00–08:00), the frequency of negative prices is moderately low but slightly higher than in the evening hours, likely due to low demand and residual renewable generation (wind energy). Notably, the plot also highlights significant volatility in the midday hours, as shown by the wider interquartile ranges and more outliers. In contrast, the evening and night hours exhibit greater stability, with narrower boxes and fewer outliers, indicating less variability in the occurrence of negative prices.
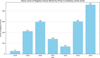 |
Fig. 2 Yearly count of hours with negative electricity prices in Germany from 2018 to 2024. The graph illustrates a sharp increase in negative price hours starting in 2019, peaking in 2024 with 457 hours. |
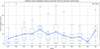 |
Fig. 3 Monthly distribution of negative electricity price hours in Germany from 2018 to 2024. The graph illustrates a consistently high count and variability of negative price hours during the spring and summer months, peaking in May. In contrast, winter months show the lowest frequency and variability, indicating more stable market conditions. |
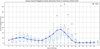 |
Fig. 4 Hourly distribution of negative electricity price hours in Germany from 2018 to 2024. The graph illustrates a consistently high count and variability of negative price hours during noontime, reflecting periods of high renewable generation and low demand. In contrast, the evening and night hours show the lowest frequency and variability, indicating more stable market conditions with higher demand and reduced solar input. |
3.2 Impact of negative electricity prices on PV and PV+BESS energy output
In the previous section, we analyzed historical electricity price data to identify temporal patterns and examine the occurrence of negative prices. The results indicate a clear upward trend in the number of hours with negative electricity prices over time. In this section, we shift to a forward-looking analysis based on electricity price forecasts, with the aim of evaluating the impact of negative electricity prices on the operation and energy output of PV systems and BESS. Two scenarios are considered: one with a low incidence of negative prices and another with a high incidence of negative prices.
To perform this analysis, we consider a utility-scale hybrid PV + BESS system with two-in-portrait (2P) single-axis tracking, located in Germany. A tracking PV configuration was selected over fixed-tilt due to its superior energy yield, which becomes increasingly advantageous as electricity offtake decreases - making trackers more favorable under such conditions in the German context. The optimization framework COSMOS was used to simulate system behavior under future market conditions. It was supplied with a 30-yr electricity price forecast (2026–2055), including DA, ID, FCR, aFRR capacity, and aFRR energy prices, provided by Aurora Energy Research [25]. The original price curves from Aurora are treated as the baseline scenario with a relatively low incidence of negative prices. To construct a hypothetical high-negative-price scenario, we developed a custom algorithm that amplifies the number of negative price hours in the forecast. This was done by selecting positive price values within each year and converting them into negative values, such that the total number of negative entries increases by a predefined amplification factor (set to 4× in this study). This method preserves the temporal pattern of the data, the linear amplification increases magnitudes without altering the underlying shape or distribution, while increasing the frequency of negative price events to enable simulation under more extreme market conditions. Consequently, under low scenario years with many forecasted negative‑price hours, retain the same temporal structure when scaled to higher scenarios. The choice of 4 as an amplification factor was intended to represent an extreme scenario, allowing us to clearly observe and quantify the behavior of PV and BESS under conditions of very high negative price hours. Furthermore, recent developments indicate that some price forecasters have been adjusting their predictions of negative price hours by significant factors, as these were often underestimated in earlier forecasts[25,36]. It is worth noting that, according to the forecast, the period from 2026 to 2030 is expected to experience the highest frequency of negative electricity prices in Germany. This is attributed to the rapid expansion of renewable energy capacity outpacing the growth of grid infrastructure and BESS deployment. Beyond 2030, the frequency of negative price events is projected to decline gradually, becoming negligible by 2050. Figure 5 depicts the evolution of the average daily spread in the day-ahead market over multiple years under both high and low negative-price scenarios. In both cases, the spread rises steadily, peaking around 2030, and then gradually declines through 2040. While the overall trend is similar across scenarios, the low–negative-price case consistently exhibits lower average daily spread values than the high–negative-price scenario.
The PV energy yield was simulated using PVsyst 8.0, employing an unlimited-sheds configuration representative of a large-scale ground-mounted solar plant. The technical specifications of the PV system, BESS, and grid connection are summarized in Table 1. The PV technology considered is TOPCon (n-type) in a large-format design to reduce balance-of-system (BoS) costs, as discussed in [42] from Canadian Solar, with a linear degradation rate of 0.4% per year. The assumed losses in PVsyst, along with the summaries of weather and irradiance data, are provided in Tables A.1 and A.2 in the annex.
The BESS employs lithium iron phosphate (LFP) cells from Trina Solar in a containerized solution, with each container offering approximately 4 MWh of energy capacity. Based on the assumed operational profile-1.5 cycles per day, 0.5 C-rate, and 95% depth of discharge (DoD)-the supplier provided a 15-yr degradation curve and round-trip efficiency (RTE) values. These were integrated into COSMOS to account for battery aging and performance decline over time. The RTE and degradation curves are confidential and therefore not shown. Additionally, COSMOS was configured with the relevant prequalification criteria and market regulations applicable in Germany [43,44] for participation in the aforementioned electricity markets. The BESS was simulated over a 15-yr operational lifetime, while the PV system was modeled across the full 30-yr project horizon. In the dispatch hierarchy, PV generation was prioritized over BESS when feeding electricity into the grid. Furthermore, the BESS was allowed to charge not only from the PV system but also from the grid. This configuration is referred to as grey storage, in contrast to green storage, where battery charging is exclusively sourced from PV generation.
Figures 6a and 6b illustrate the relative changes in annual PV energy output and curtailed PV energy, respecively, when comparing a high negative price scenario against a baseline scenario with a lower incidece of negative electricity prices.
As shown in Figure 6a, PV energy output experiences a substantial reduction under high negative price conditions – up to 10% in 2026. This negative impact gradually diminishes over time, becoming negligible beyond 2050. The primary driver of this reduction is increased PV energy curtailment, as depicted in Figure 6b. Under the high-negative-price scenario, curtailed energy increases by approximately 100% relative to the baseline. The elevated frequency of negative prices forces the system to limit PV feed-in more frequently, particularly in the early years (2026–2035), when grid constraints and insufficient flexibility from storage or market absorption capacity exacerbate curtailment. Over time, as market conditions improve and curtailment pressures ease, these effects diminish accordingly.
In contrast to the production observed in PV energy output, Figure 6c shows that total BESS energy production increases significantly under the high negative prices scenario compared to the baseline. From 2026 to approximately 2035, BESS production exhibits a notable relative increase - peaking around 2030 - before gradually declining through 2041 as the frequency of negative price events diminishes.
The breakdown of this increse is further clarified in Figure 6d, which shows the relative changes in BESS energy allocated to the day-ahead/intraday and aFRR energy markets. The data reveals that the surge in total BESS production is primarily driven by a substantial increase in DA/ID market participation under high-negative-price conditions. Meanwhile, BESS energy provision for aFRR decreases moderately. However, this reduction in aFRR participation is relatively minor when compared to the gains observed in the DA/ID markets, resulting in a net positive effect on overall BESS energy output. These findings suggest that in an environment with frequent negative electricity prices, BESS units are able to leverage low-cost charging opportunities and increase arbitrage activity in the DA/ID markets, thus enhancing their operational performance.
Technical specifications of the simulated PV + BESS system.
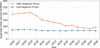 |
Fig. 5 Average daily spread of day‑ahead electricity prices from 2026 to 2040 under high and low negative‑price scenarios. |
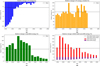 |
Fig. 6 Relative changes in PV and BESS energy performance under high versus low negative electricity price scenarios. (a) Relative change in PV energy sold to the grid for 30 years from 2026. (b) Relative change in curtailed PV energy for 30 years from 2026. (c) Relative change in total BESS energy sold for 15 years from 2026. (d) Relative change in BESS energy sold on DA/ID and aFRR markets for 15 years from 2026. All changes are expressed relative to the low negative price scenario as baseline. |
3.3 Economic value of PV and PV + BESS under negative electricity prices
In this section, we evaluate the techno-economic performance of a utility-scale PV system and a hybrid (PV + BESS) configuration under two electricity market scenarios: a baseline scenario with a relatively low incidence of negative prices, and a high-negative-price scenario reflecting a greater frequency of negative electricity prices. The system setup - including PV and BESS sizing and configurations – remains consistent with that used in the previous section. We assume an existing PV plant retrofitted with a BESS, with both systems sharing the same grid connection and capacity limits.The capital expenditures (CAPEX) and operational expenditures (OPEX) for the standalone PV system are €540/kW and €13.2/kW, respectively. For the hybrid setup (PV + Battery), the CAPEX and OPEX are €1,159/kW and €19.2/kW, respectively. It worth mentioning that, the CAPEX and OPEX values used in our study were obtained through a request-for-quotation (RFQ) campaign conducted with several BESS suppliers. Among the quotations received, the lowest price was applied in our analysis. The discount and inflation rates are the same for both the PV and hybrid cases, at 8% and 2%, respectively [45]. The primary economic performance indicator used is the NPV which was introduced previosuly, For the PV system, a 30-yr operational lifetime is considered, while the BESS is assumed to operate over a 15-yr period.
Figure 7 illustrates the economic impact of integrating a BESS with a PV plant under varying electricity price scenarios (1), (2) and (3). Under the high-negative-price scenario (1), the standalone PV system experiences a significant reduction in relative NPV, declining by approximately 10%. In contrast, retrofitting the PV plant with a co-located BESS significantly improves its economic performance. The hybrid system achieves a relative NPV increase of around 51% in the low-negative-price scenario (2) and approximately 135% in the high-negative-price scenario - both (3) compared to the baseline standalone PV configuration.
These results clearly demonstrate that the hybrid system consistently outperforms the standalone PV plant across different market conditions. The integration of BESS not only mitigates downside risk but also unlocks substantial upside potential, highlighting its strategic importance. Overall, BESS emerges as a key enabler of economic resilience and value optimization for PV assets in increasingly volatile electricity markets, the added value by BESS per market is reported in Table A.3 in the annex.
Various KPIs (NPV, IRR and discounted payback time) for each scenario compared to the reference (PV - low scenario) are reported in Table 2, as can be seen, that the PV-low scenario, used as the reference, performs consistently worse than hybrid configurations across all economic indicators. The PV-only system under the high scenario exhibits lower NPV, reduced IRR, and a longer discounted payback period, indicating weaker financial viability. In contrast, the hybrid PV + BESS system delivers substantial improvements, especially under the high scenario, where NPV and IRR increase markedly and payback time shortens by three years.
In Section 3.2, we showed that PV systems experience frequent curtailment under conditions of persistently negative electricity prices. A common assumption is that integrating a battery energy storage system with a PV plant mitigates this curtailment and thereby increases the net present value (€) of the PV component. However, our analysis of PV curtailment as a function of BESS capacity reveals that curtailment remains essentially unchanged, even as storage capacity increases. In contrast, total system revenues (PV + BESS) increase monotonically with growing BESS capacity. This indicates that the hypothesized value enhancement through reduced PV curtailment does not hold in this setting; instead, the observed increase in system value is driven entirely by additional revenues generated by the BESS itself. This behavior is illustrated in Figure 8.
Importantly, these additional BESS revenues arise from the assumption of grey storage, whereby charging from the grid is permitted. As an outlook, future work should examine how these findings change under green-storage constraints, in which grid charging is prohibited and the revenue-generating potential of the BESS may therefore be substantially reduced.
To better understand the year-to-year revenue dynamics under varying market conditions, Figure 9 presents the relative change in revenues for PV and BESS systems between the baseline and high-negative-price scenarios from 2026 to 2055. The results show that while PV revenues decline over time under high negative prices, BESS revenues improve significantly. Importantly, the loss in PV value becomes negligible beyond 2050 as the frequency of negative electricity price hours diminishes. As discussed in previous sections, this improvement is anticipated due to expanding grid capacity, improved market conditions, and greater storage availability, all of which are expected to reduce the occurrence of negative prices by 2050. These findings highlight the importance for project developers and investors to design storage-ready PV plants. Integrating storage, either from the outset or as a future retrofit, is a key strategy to protect and enhance the long-term value of PV assets in evolving electricity markets.
To analyze the behavior of the dispatch algorithm under conditions of high negative electricity prices, we examined the relative deviation in BESS revenues across different market segments compared to a baseline scenario, as shown in Figure 10. The results reveal that the wholesale markets – specifically DA/ID segments – benefit the most under high negative price conditions, with BESS revenues increasing by up to 200%. This indicates that the dispatch algorithm prioritizes arbitrage opportunities in these markets during periods of price volatility. In contrast, ancillary service markets such as aFRR energy, aFRR capacity, and FCR exhibit a decline in revenue contributions, with aFRR energy and FCR being the most negatively affected. The FCR and aFRR markets become less favorable for BESS participation under high negative price scenarios due to lower remuneration compared to DA/ID markets. Over the modeled period from 2026 to 2040, the optimization tends to allocate a larger share of battery capacity to arbitrage opportunities during years with frequent negative prices, which consequently limits the capacity available for ancillary services.
 |
Fig. 7 Relative NPV comparison of PV standalone and hybrid systems under different scenarios. |
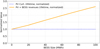 |
Fig. 8 Normalized lifetime PV curtailed energy and combined PV+BESS revenues as a function of BESS size. While curtailed PV energy remains constant across storage capacities, the addition of BESS steadily increases total system revenues. |
Comparison of NPV, IRR, and discounted payback time across different scenarios (PV – low scenario used as reference).
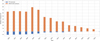 |
Fig. 9 Relative change in revenues for PV and BESS systems between baseline and high-negative-price scenarios from 2026 to 2040. The figure highlights the early revenue gains from BESS due to increased arbitrage opportunities, peaking around 2030, and the gradual decline thereafter. PV revenues show tangible losses in the early years, which become negligible beyond 2040 as negative price events diminish. These trends underscore the long-term value of integrating storage with PV systems to mitigate market volatility. |
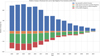 |
Fig. 10 Relative deviation in BESS revenues across different market segments (DA/ID, aFRR capacity, aFRR energy, and FCR) under high negative electricity price scenarios compared to the baseline, from 2026 to 2040. The figure highlights the increased revenue potential in wholesale markets (DA/ID) and the reduced contributions from ancillary services, with overall deviations diminishing over time. |
4 Conclusion
Rapid growth in solar and wind supports global decarbonization goals but has also led to unintended effects, most notably negative electricity prices that may hinder further renewable expansion. This study focuses on Germany, a leading PV market with frequent negative price events, analyzing their historical development and future scenarios. It evaluates the impacts on PV performance and assesses economically viable solutions to strengthen the resilience and value of renewable energy assets.
A detailed temporal analysis reveals that negative price events have become significantly more frequent, rising from just 27 hours in 2018 to a record 457 hours in 2024. This trend underscores the growing impact of renewable energy integration and market volatility. Seasonally, negative prices are most common in spring - especially May - coinciding with high solar generation and moderate demand. Diurnally, these events peak around midday, aligning with solar output surpluses and reduced consumption, particularly on weekends and holidays.
The economic analysis shows that adding a BESS to a PV plant substantially improves financial performance under negative price conditions. Standalone PV systems suffer declining NPV due to curtailment and lower revenues, whereas hybrid PV-BESS systems consistently outperform by reducing downside risk and capturing additional value. While PV revenues fall as negative price events increase, BESS revenues rise sharply through participation in day-ahead and intraday markets. As negative pricing becomes less frequent over time, the performance gap narrows, but the results clearly highlight the strategic value of storage-ready PV systems - either integrated from the outset or retrofitted - to preserve and enhance asset value in evolving electricity markets.
Importantly, the analysis challenges the common assumption that larger BESS capacity substantially reduces PV curtailment. While total hybrid system revenues (PV + BESS) rise monotonically with storage size, this gain is driven almost entirely by BESS market revenues rather than by reductions in PV curtailment. This finding contradicts the widely held view that curtailment mitigation is a primary driver of storage value in coupled PV‑BESS projects.
As an outlook, future work should investigate hybrid green energy systems in which the BESS is not permitted to charge from the grid, comparing their operational and economic performance against the results presented here. This would provide deeper insights into optimal system design under emerging regulatory and market frameworks.
Funding
This research received no external funding.
Conflicts of interest
The authors declare no competing financial or personal interests that could have influenced the work reported in this paper.
Data availability statement
The day-ahead electricity price data analyzed in this study were obtained from the open-access platform smard.de, operated by the German Federal Network Agency. These publicly available datasets can be accessed by readers for verification and further research.
Author contribution statement
Djaber Berrian, Gaurang Chhapia, and Rene VanBaal contributed to the conceptualization of the study. Methodology was developed by Djaber Berrian and Gaurang Chhapia. Software was provided by Gaurang Chhapia, while formal analysis and data curation were performed by Djaber Berrian. Investigation was carried out by Djaber Berrian and Gaurang Chhapia. Resources and supervision were provided by Johannes Linder. Writing of the original draft, as well as review and editing, were done by Djaber Berrian and Gaurang Chhapia. Visualization was prepared by Djaber Berrian. Project administration was managed by Johannes Linder.
References
- PV Magazine, Europe posts negative power prices for 2024 as renewables rise, PV Magazine (2025). https://www.pv-magazine.com [Google Scholar]
- BRIDGE Initiative, Battery energy storage systems to support the large-scale integration of renewable energy, bess case study (2025). https://bridge-smart-grid-storage-systems-digital-projects.ec.europa.eu/sites/default/files/case-studies/03_BESS_Case. Accessed: 2025-07-15 [Google Scholar]
- Solarplaza, Investment outlook for utility-scale pv & bess projects in the nordics (2024). https://www.solarplaza.com/resource/13086/webinar-investment-outlook-for-utility-scale-pv-bess-projects-in-the-nordics-2024/. Accessed: 2025-07-15 [Google Scholar]
- PV Magazine, Europe posts negative power prices for 2024 as renewables rise, PV Magazine (2025). Accessed: 2025-07-15 [Google Scholar]
- L. Hirth, The market value of variable renewables: The effect of solar and wind power variability on their relative price, Energy Econ. 38, 218 (2013) [Google Scholar]
- N. Navid, G. Rosenwald, Market solutions for managing ramp flexibility with high penetration of renewable resource, IEEE Trans. Sustain. Energy 3, 784 (2012) [Google Scholar]
- P.D. Lund, J. Lindgren, J. Mikkola, J. Salpakari, Review of energy system flexibility measures to enable high levels of variable renewable electricity, Renew. Sustain. Energy Rev. 45, 785 (2015) [Google Scholar]
- T. Brown, D. Schlachtberger, A. Kies, S. Schramm, M. Greiner, Synergies of sector coupling and transmission reinforcement in a cost-optimised, highly renewable european energy system, Energy 160, 720 (2018) [Google Scholar]
- G.T. Giannakopoulos, D.A. Papadaskalopoulos, M.D. Karasavvidis, P.N. Vovos, Profitability analysis of battery energy storage in energy and balancing markets: a case study in the greek market, Energies 18, 911 (2025) [Google Scholar]
- M.E. Ölmez, I. Ari, G. Tuzkaya, A comprehensive review of the impacts of energy storage on power markets, J. Energy Storage 91, 111935 (2024) [Google Scholar]
- G. Albright, J. Edie, S. Al-Hallaj, A comparison of lead acid to lithium-ion in stationary storage applications, AllCell Technologies LLC 5, 1 (2012) [Google Scholar]
- K. Mongird, V. Viswanathan, P. Balducci, J. Alam, V. Fotedar, V. Koritarov, B. Hadjerioua, An evaluation of energy storage cost and performance characteristics, Energies 13, 3307 (2020) [Google Scholar]
- K. Marnell, M. Obi, R. Bass, Transmission-scale battery energy storage systems: a systematic literature review, Energies 12, 4603 (2019) [Google Scholar]
- C. Zhao, P.B. Andersen, C. Træholt, S. Hashemi, Grid-connected battery energy storage system: a review on application and integration, Renew. Sustain. Energy Rev. 182, 113400 (2023) [Google Scholar]
- Y. Shi, B. Xu, D. Wang, B. Zhang, Using battery storage for peak shaving and frequency regulation: Joint optimization for superlinear gains, IEEE Trans. Power Syst. 33, 2882 (2017) [Google Scholar]
- Q. Hassan, B. Pawela, A. Hasan, M. Jaszczur, Optimization of large-scale battery storage capacity in conjunction with photovoltaic systems for maximum self-sustainability, Energies 15, 3845 (2022) [Google Scholar]
- F. Conte, S. Massucco, G.-P. Schiapparelli, F. Silvestro, Day-ahead and intra-day planning of integrated bess-pv systems providing frequency regulation, IEEE Trans. Sustain. Energy 11, 1797 (2019) [Google Scholar]
- M. Sandelic, A. Sangwongwanich, F. Blaabjerg, Reliability evaluation of pv systems with integrated battery energy storage systems: Dc-coupled and ac-coupled configurations, Electronics 8, 1059 (2019) [Google Scholar]
- J. He, Y. Yang, D. Vinnikov, Energy storage for 1500 v photovoltaic systems: a comparative reliability analysis of dc-and ac-coupling, Energies 13, 3355 (2020) [Google Scholar]
- F. Lo Franco, A. Morandi, P. Raboni, G. Grandi, Efficiency comparison of dc and ac coupling solutions for large-scale pv+ bess power plants, Energies 14, 4823 (2021) [Google Scholar]
- L. Zhou, Y. Zhang, X. Lin, C. Li, Z. Cai, P. Yang, Optimal sizing of pv and bess for a smart household considering different price mechanisms, IEEE Access 6, 41050 (2018) [Google Scholar]
- J. Atherton, J. Akroyd, F. Farazi, S. Mosbach, M.Q. Lim, M. Kraft, British wind farm ess attachments: curtailment reduction vs. price arbitrage, Energy Environ. Sci. 16, 4020 (2023) [Google Scholar]
- L. Semmelmann, S. Henni, C. Weinhardt, Profitability of stationary battery storage in day-ahead trading considering uncertainty, degradation, and the changing market environment, in Proceedings of the 13th Internationale Energiewirtschaftstagung (IEWT 2023) (Karlsruhe Institute of Technology 2023) [Google Scholar]
- A. Gailani, T. Crosbie, M. Al-Greer, M. Short, N. Dawood, On the role of regulatory policy on the business case for energy storage in both eu and uk energy systems: barriers and enablers, Energies 13, 1080 (2020) [Google Scholar]
- Aurora Energy Research, Chronos for Batteries (2025). https://auroraer.com/software/chronos. Accessed July 21, 2025 [Google Scholar]
- EPEX SPOT, Day-Ahead Market Overview (2025). https://www.epexspot.com/en/basicspowermarket. Accessed December 15, 2025 [Google Scholar]
- D. Andreotti, M. Spiller, A. Scrocca, F. Bovera, G. Rancilio, Modeling and analysis of bess operations in electricity markets: prediction and strategies for day-ahead and continuous intra-day markets, Sustainability 16, 7940 (2024) [Google Scholar]
- M. Kremer, R. Kiesel, F. Paraschiv, An econometric model for intraday electricity trading, Philos. Trans. Royal Soc. A 379, 20190624 (2021) [Google Scholar]
- H. Martin, S. Otterson, German intraday electricity market analysis and modeling based on the limit order book, in 2018 15th international conference on the European energy market (EEM) (IEEE 2018), p.1 [Google Scholar]
- ENTSO-E, Frequency Containment Reserve (FCR) Cooperation – Market Design and Implementation (2025). https://www.entsoe.eu/network_codes/eb/fcr/. Accessed December 15, 2025 [Google Scholar]
- J. Badeda, J. Meyer, D.U. Sauer, Modeling the influence of installed battery energy storage systems on the german frequency containment reserve market, in NEIS 2017, Conference on Sustainable Energy Supply and Energy Storage Systems (VDE, 2017), p. 1 [Google Scholar]
- M. Hooimeijer, Economic performance of bess on the afrr, Master’s thesis, Utrecht University, 2025 [Google Scholar]
- UL Solutions, HOMER® Microgrid and Hybrid Power Modeling Software (2025). https://www.ul.com/software/ultrus/homer-microgrid-and-hybrid-power-modeling-software. Accessed March 14, 2025 [Google Scholar]
- Fractal EMS, Fractal Model Overview (2025). https://fractalems.com/fractal-model-overview/. Accessed March 14, 2025 [Google Scholar]
- R. Locquet, Unlocking bess revenues in europe’s key markets, PVTech Magazine, Published by Clean Horizon, (2025). Accessed via PVTech [Google Scholar]
- C. Horizon, Major Upgrade to Clean Horizon’s COSMOS Tool (2025). https://www.cleanhorizon.com/news/major-upgrade-to-clean-horizons-cosmos-tool/. Accessed July 21, 2025 [Google Scholar]
- M. Energy, What Does Modo Energy Do? (2025) https://help.modo.energy/en/articles/8347698-what-does-modo-energy-do-and-what-can-you-do-with-modo-energy. Accessed July 21, 2025 [Google Scholar]
- N.M. Alavijeh, R. Khezri, M. Mazidi, D. Steen, A.T. Le, Profit benchmarking and sdegradation analysis for revenue stacking of batteries in sweden’s day-ahead electricity and frequency containment reserve markets, Appl. Energy 381, 125151 (2025) [Google Scholar]
- J. Gonzalez-Saenz, V. Becerra, Optimal battery energy storage dispatch for the day-ahead electricity market, Batteries 10, 228 (2024) [Google Scholar]
- S. Tripathy, Q. Deng, D. Tylavsky, T. Stowers, R. Hess, Establishing the stacked value of battery energy storage in electric power systems, in 2018 North American Power Symposium (NAPS) (IEEE, 2018), p.1 [Google Scholar]
- S. Yamujala, A. Jain, R. Bhakar, J. Mathur, Multi-service based economic valuation of grid-connected battery energy storage systems, J. Energy Storage 52, 104657 (2022) [Google Scholar]
- D. Berrian, L. Johannes, Impact of large format solar panels on the balance of system costs of photovoltaic power plants, in 8th World Conference on Photovoltaic Energy Conversion (Milan, September 2022), p. 1377 [Google Scholar]
- Regelleistung.net, Prequalification Conditions (PQ-Bedingungen) for FCR, aFRR, and mFRR (July 2024). https://www.regelleistung.net/en-us/Become-a-balancing-service-provider/Prequalification. Accessed December 15, 2025 [Google Scholar]
- A. Scrocca, F. Bovera, G. Rancilio, M. Delfanti, Exploring the true potential of battery revenues stacking in europe: a comparison of italian and german electricity spot markets, Available at SSRN 5027648 (2024) [Google Scholar]
- E. Vartiainen, G. Masson, C. Breyer, D. Moser, E.R. Medina, Impact of weighted average cost of capital, capital expenditure, and other parameters on future utility-scale pv levelised cost of electricity, Prog. Photovolt.: Res. Appl. 28, 439 (2020) [Google Scholar]
Cite this article as: Djaber Berrian, Gaurang Chhapia, René VanBaal, Johannes Linder, Enhanced value of grid-connected PV with battery storage in a negative price environment, EPJ Photovoltaics 17, 20 (2026), https://doi.org/10.1051/epjpv/2026012
Annex
Assumed losses in PVsyst
Summary of yearly average weather and irradiance data used for the simulation
NPV added value of BESS by market under low and high scenarios
Overview of BESS modeling tools: market coverage and core capabilities.
All Tables
Comparison of NPV, IRR, and discounted payback time across different scenarios (PV – low scenario used as reference).
All Figures
|
Fig. 1 A visual representation illustrating the required inputs, optimization processes, and expected outputs of the COSMOS dispatch framework for front-of-the-meter BESS operation in multi-market environments. |
| In the text | |
|
Fig. 2 Yearly count of hours with negative electricity prices in Germany from 2018 to 2024. The graph illustrates a sharp increase in negative price hours starting in 2019, peaking in 2024 with 457 hours. |
| In the text | |
|
Fig. 3 Monthly distribution of negative electricity price hours in Germany from 2018 to 2024. The graph illustrates a consistently high count and variability of negative price hours during the spring and summer months, peaking in May. In contrast, winter months show the lowest frequency and variability, indicating more stable market conditions. |
| In the text | |
|
Fig. 4 Hourly distribution of negative electricity price hours in Germany from 2018 to 2024. The graph illustrates a consistently high count and variability of negative price hours during noontime, reflecting periods of high renewable generation and low demand. In contrast, the evening and night hours show the lowest frequency and variability, indicating more stable market conditions with higher demand and reduced solar input. |
| In the text | |
|
Fig. 5 Average daily spread of day‑ahead electricity prices from 2026 to 2040 under high and low negative‑price scenarios. |
| In the text | |
|
Fig. 6 Relative changes in PV and BESS energy performance under high versus low negative electricity price scenarios. (a) Relative change in PV energy sold to the grid for 30 years from 2026. (b) Relative change in curtailed PV energy for 30 years from 2026. (c) Relative change in total BESS energy sold for 15 years from 2026. (d) Relative change in BESS energy sold on DA/ID and aFRR markets for 15 years from 2026. All changes are expressed relative to the low negative price scenario as baseline. |
| In the text | |
|
Fig. 7 Relative NPV comparison of PV standalone and hybrid systems under different scenarios. |
| In the text | |
|
Fig. 8 Normalized lifetime PV curtailed energy and combined PV+BESS revenues as a function of BESS size. While curtailed PV energy remains constant across storage capacities, the addition of BESS steadily increases total system revenues. |
| In the text | |
|
Fig. 9 Relative change in revenues for PV and BESS systems between baseline and high-negative-price scenarios from 2026 to 2040. The figure highlights the early revenue gains from BESS due to increased arbitrage opportunities, peaking around 2030, and the gradual decline thereafter. PV revenues show tangible losses in the early years, which become negligible beyond 2040 as negative price events diminish. These trends underscore the long-term value of integrating storage with PV systems to mitigate market volatility. |
| In the text | |
|
Fig. 10 Relative deviation in BESS revenues across different market segments (DA/ID, aFRR capacity, aFRR energy, and FCR) under high negative electricity price scenarios compared to the baseline, from 2026 to 2040. The figure highlights the increased revenue potential in wholesale markets (DA/ID) and the reduced contributions from ancillary services, with overall deviations diminishing over time. |
| In the text | |
Current usage metrics show cumulative count of Article Views (full-text article views including HTML views, PDF and ePub downloads, according to the available data) and Abstracts Views on Vision4Press platform.
Data correspond to usage on the plateform after 2015. The current usage metrics is available 48-96 hours after online publication and is updated daily on week days.
Initial download of the metrics may take a while.