| Issue |
EPJ Photovolt.
Volume 17, 2026
|
|
|---|---|---|
| Article Number | 18 | |
| Number of page(s) | 11 | |
| DOI | https://doi.org/10.1051/epjpv/2026011 | |
| Published online | 24 April 2026 | |
https://doi.org/10.1051/epjpv/2026011
Viewpoint
Snapshot of photovoltaics—February 2026
European Commission, Joint Research Centre (JRC), Via E. Fermi 2749, I-21027 Ispra (VA), Italy
* e-mail: This email address is being protected from spambots. You need JavaScript enabled to view it.
Received:
17
February
2026
Accepted:
26
March
2026
Published online: 24 April 2026
Abstract
In 2025, global energy transition investments increased by 8% per annum to USD 2,309 billion or 2% of global gross domestic product. Despite a decrease of investments in solar photovoltaics of 11.5%, the newly installed capacity increased by over 15% to reach almost 700 GWp. Globally, the installed solar photovoltaic capacity exceeded 2.95 TWp at the end of 2025. The number of countries installing 1 GWp/year or more has increased by 8 to 44. In 2025, investments in small-scale photovoltaics exceeded investments for large-scale photovoltaic plants by 28%. Levelised costs of electricity for non-tracking solar photovoltaic systems as well as the levelised cost of battery storage decreased again and reached new lows. Countries in emerging economies with grid stability problems and rapidly rising electricity demand for cooling, mainly to combat heat waves, have shown exceptionally high growth rates in new PV installations. Additional demand for renewable electricity and solar photovoltaics is created by a general trend towards electrification of heating, transport, and industry. Market expectations for 2026 are mixed from a shrinking market to a moderate one-digit growth. Needless to mention, neither market expectations are in line with the market growth needed to achieve an annual market of 2.25 TWp by 2030 nor are they on track to realise a 100% renewable energy scenario by 2050.
Key words: Renewable energies / photovoltaic / energy transition / policy options / technological development / market development
© A. Jäger-Waldau, Published by EDP Sciences, 2026
 This is an Open Access article distributed under the terms of the Creative Commons Attribution License (https://creativecommons.org/licenses/by/4.0), which permits unrestricted use, distribution, and reproduction in any medium, provided the original work is properly cited.
1 Introduction
In 2025, the worrying succession of extreme temperatures continued, and according to the State of the Global Climate Update from the World Meteorological Organization (WMO), prepared for COP 30, it was on track to be the second or third warmest year on record [1]. The increase of greenhouse gas levels and ocean heat continued in 2025 after they had already reached record levels in 2024. Both Arctic ice coverage after the winter freeze and the sea ice extent in Antarctica were below the long-time average throughout the year. The long-term trend of sea level rise is still intact.
According to the WMO report, the last 11 yr from 2015 to 2025 were the warmest years in the 176-yr history of climate records. The increasing sequence of extreme weather conditions and temperature rise highlights the threats to human life due to human-made warming and should make clear the urgency and need to speed up the energy transition from the current fossil-based energy system to a renewable-based one.
During COP 28 in 2023, 123 countries signed the renewable energy pledge to triple the power capacity of renewable energy sources by 2030 compared to 2022 [2]. The pledge of tripling the renewable power capacity is, however, below the necessary global capacity increase of 3.2 to 3.4 times needed to fulfil the Paris Agreement and be compatible with the 1.5°C limit. The range of renewable power capacity needed by 2030 varies between 11.2 TWAC and 11.5 TWAC depending on the scenarios from the International Energy Agency (IEA) World Energy Outlook (WEO), the net zero by 2050 scenario (NZE2024), the International Renewable Energy Agency (IRENA), and climate analytics [3,4,5].
The compound annual growth rate (CAGR) for total electricity generation in the WEO 2025 is given as 4% between 2024 and 2030 and 3.7% between 2024 and 2050, but no CAGR for renewables is given. Since WEO 2025 has no 2030 scenario data for renewable energy any longer, the comparison is now based on 2035 [6], as linear extrapolations for 2030 are not meaningful in the current market environment.
NZE2025 forecasts a renewable electricity generation of 36,615 TWh in 2030 (39,128 TWh in the NZE2024) and 71,220 TWh in 2050 (70,936 TWh in the NZE2024) [6]. Compared with the actual electricity generation by renewables of 9935 TWh in 2024, this requires a 3.7-time increase until 2035 and more than a sevenfold increase until 2050. Despite the lower renewable electricity generation in this scenario compared to 2024, the share of renewable electricity generation is almost the same, at 79% in 2035, due to a lower total electricity generation. It is unclear how this scenario considers the general trend of electrifying the transport sector and industry and the rapidly growing electricity demand of data centres.
By 2023, the major sources of electricity generation in the NZE2025 scenario are solar photovoltaic (PV) with 16,415 TWh (12,499 GWp) and wind with 11,898 TWh (4,494 GWAC). To reach the solar photovoltaic capacity, a fourfold increase of the existing capacity at the end of 2025 (2953 GWp) is required (Fig. 1). Together solar photovoltaics and wind are expected to provide 59% of the total electricity production in 2035. This general development can be observed worldwide, even if the technology mix and pace of renewable energy deployment vary from country to country.
The overall cost reduction trend for solar PV systems is still intact, even if factory gate PV module prices are fluctuating. The continuation of cost reductions for PV systems and the advantage of PV technology that it can be deployed in every country as well as in a modular way almost everywhere on this planet, from installations with a few Wp capacity to multi-GWp solar plants, are main drivers for the growth of PV deployment. However, political and regulatory changes in several countries might slow down the growth temporarily.
In 2025, global energy transition investments increased by 8% per annum to USD 2.309 billion, or 2% of global gross domestic product (GDP) [9]. Despite a decrease of 11.5% in solar system investments, the annual installed PV capacity increased by 15% to 697 GWp. The investments’ decrease was due to a 28.5% decrease in utility-scale projects, whereas the small-decentralised PV sector grew by 8.8% and accounted for 56% of solar investments in 2025. Investments in electrified transport were USD 893 billion, followed by USD 483 billion for power grids; solar power generation with USD 436 billion; wind power with USD 225.4 billion; electrified heat (mainly heat pumps) with USD 84.4 billion; and energy storage with USD 71.0 billion. All other clean energy technologies together (bioenergy, carbon capture, clean industry, clean shipping, geothermal, hydrogen, and nuclear) attracted investments of USD 116 billion.
Comparing the USD 2.3 trillion in 2025 with the investment needs from various studies for net-zero economies by 2050, which range between USD 100 trillion and USD 275 trillion (annually USD 3.5 and 9.2 trillion) for the time span between 2021 and 2050, it is obvious that the current efforts are not enough to reach the goal [10–13]. Looking at the McKinsey upper investment needs of USD 9.2 trillion per annum, it should be mentioned that in this scenario USD 2.7 trillion per year for high-carbon (fossil fuel) assets are still included.
To put these investments into context, they should be compared to the current annual direct and indirect government subsidies for fossil fuels, which amounted to USD 7.42 trillion, or 6.4 percent of worldwide GDP, in 2024 [14]. Environmental and health costs now account for roughly 90% of the USD 6.4 trillion. Explicit fossil fuel subsidies have fallen from USD 1.4 trillion in 2022 to USD 725 billion in 2024 (0.63% of global GDP) and are expected to stay in the same order of GDP in the coming years. According to the International Monetary Fund (IMF), the removal of the explicit fuel subsidies would reduce global CO2 emissions by 6% until 2035, generate revenues of 0.5% of global GDP and generate economic benefits worth another 0.5% of global GDP.
For the first time since 2020, annual renewable power investments decreased by 9.5% from USD 762 billion in 2024 to USD 690 billion in 2025, whereas annual investments in the global fossil fuel supply decreased only by 2% to USD 1 trillion [15]. The main reason for this modest decline was a 6% decrease in the upstream oil investments to USD 420 billion, driven by the drop in oil prices, which is challenging the profitability of shale oil in the USA.
The question persists whether NZE2025 is ambitious enough to stay on a 1.5°C trajectory. Different research groups have presented scenarios that outline the need for a faster transition towards electrification and utilisation of renewable energy sources, including PV [16–19]. To balance the United Nations (UN) development goals and climate costs, the needed PV capacity in these scenarios ranges between 60 and 80 TWp by 2050. Under the assumption that direct electrification is used where possible, the PV capacity needed to provide electricity for the electrification of heat generation, transport and industry would have to increase even more [20,21].
Uncertainty in reported capacity numbers
Not all countries report standard nominal power capacity for solar PV systems (DC capacity expressed as Wp under standard test conditions) but instead cite the inverter or electrical grid connection capacity, which is in AC. Over the last decade, “overpowering”, i.e., when the DC capacity is larger than the AC capacity [22], has gradually increased, and DC/AC ratios of up to 2 can be observed. This means that the nominal capacity of the PV system can be significantly higher than the reported AC capacity. Overpowering of PV systems leads to a better utilisation of the grid connection capacity and can be cheaper than installing electricity voltage stabilisers to maintain a steady supply at the required power.
Looking at energy system scenarios, modellers are only interested in AC capacity, since the electricity network is AC. Therefore, significant differences can exist between the actual needed nominal power of PV systems, which in turn determines the number of modules needed, and the modelled network PV capacity.
The capacity numbers of PV installations in this paper are given in nominal DC power or Wp. Production volumes of PV cells and modules are reported here in Wp as well. Where national statistics report capacities in AC, a conversion factor based on industry information and project descriptions is used to give a DC value.
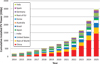 |
Fig. 1 Cumulative photovoltaic installations from 2014 to 2025 (data source: [7,8] and own analysis). |
2 PV solar cell production
Global solar cell production1 estimates range from 850 to 900 GWp for 2025 and might increase further with all the new capacities coming online in 2026. As shipment figures, sales numbers and solar products are reported inconsistently, and the decreasing number of public companies as well as different accounting and reporting rules all add to uncertainty in this data.
For this paper, data were collected from stock market reports of listed companies, press announcements, and market reports, which were then cross-checked. For 2025 this led to an estimate of 878 GWp, an increase of about 15% compared to 2024 (Fig. 2). The share of thin-film solar modules is estimated to be in the range of 2%. Numbers from previous years were updated where necessary. China exported over 100 GWp of solar cells and more than 350 GWp of solar modules.
The expansion of production capacities along the value chain of solar photovoltaics continued in 2024 but at a slower pace [8]. A total polysilicon production capacity of 3,702,300 tonnes now available would be enough to manufacture 1763 GWp of silicon solar cells. At the end of 2025, solar wafer, cell, and module production capacities were enough to manufacture 1358 GWp of wafers, 1584 GWp of solar cells, and 1635 GWp of modules. Looking at these numbers, one should bear in mind that a non-negligible part of these capacities are older production lines with different wafer sizes and lower efficiencies, which very likely are no longer competitive. Therefore, the competitive state-of-the-art production capacity is significantly lower but still far above the actual market size.
After a compound annual growth rate (CAGR) of 29.6% between 2014 and 2025, it is expected that manufacturing volumes in 2026 will stagnate or even decline by up to 16% [23]. It is argued that a pullback, mainly in China, and the tightening of renewable energy policies in a growing number of countries are the main reasons behind this development. However, as already seen in the past, Chinese demand might prove more robust than anticipated due to political pressure to maintain jobs in the Chinese manufacturing industry and project developers. It is worthwhile to mention that Chinese annual installation targets are given in AC. The 15th Chinese 5-yr plan sets a target of an additional 1.1 TWac of PV by 2030, or 220 GWac (308 GWp) annually. This is significantly lower than the 315 GWac installed in 2025, but given the fact that the 14th 5-yr plan’s 2030 target was already reached during 2024, higher installation and production figures are very possible [24].
Nevertheless, the current market trends are not in line with the market growth needed to achieve an annual market of 2.25 TWp by 2030 to be on track to realise a 100% renewable energy scenario by 2050 [19,20,25].
The rapid growth of solar photovoltaics and the capacities needed for a renewable energy supply pose the question of whether the availability of certain materials could limit the growth of photovoltaics.
Numerous studies and roadmaps show various available alternative routes in solar cell and module design as well, and the overall availability of materials does not present a roadblock for the global multi-TW growth of photovoltaics [26]. Nevertheless, for some materials the economic provision can be affected if other, non-PV-related products compete for the same resource.
To future-scale solar cell manufacturing in a sustainable way, further cost and material input reductions are needed [27].
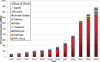 |
Fig. 2 World PV cell/thin film module production from 2014 to 2025. |
3 Solar PV electricity generation and markets
After the temporary increase of the global benchmark LCOE2 (levelised cost of electricity) for electricity produced by PV systems between the end of 2021 and 2022, LCOE for PV continued to decline from 2023 on. For non-tracking systems, the LCOE of USD2024 36 per MWh was observed at the end of 2025 [28]. Due to lower module prices caused by the oversupply along the value chain, LCOE for PV electricity decreased further in 2025 and has fallen below USD2025 30 per MWh in China [29]. LCOE for PV tracking systems was lowest in Africa and the Middle East, with USD2025 37 per kWh.
The unresolved global trade tariff situation is adding uncertainty and can have serious effects on the energy transition and PV deployment, mainly in Europe and the USA [30]. Already in 2024, China considered export restrictions for certain battery components, PV manufacturing equipment and certain critical raw materials.
Only the general trend is shown by global LCOE. Local factors like financing and labour costs, regulatory requirements, import duties, and taxes have a significant influence on the real local generation costs. Additional factors like actual solar radiation; technology choice (type of PV module, tracking or fixed); PV system design (module orientation, string or central inverter); off-taker contract conditions (take or pay, power purchase agreements (PPA), merchant, etc.); operation and maintenance (O&M); as well as connection costs influence the economic viability of a PV installation as well. Total financing cost, or weighted cost of capital, plays an important role in the final generation costs, regardless of the size of the PV system [31]. The competition in the respective electricity market and the ability to freely participate in it are another determining factor, which influences the willingness to invest [32]. To summarise, stable and reliable political and regulatory conditions are important factors to attract investors.
To install more PV systems and faster, batteries for electricity storage are seen as an enabler to ease the pressure on existing electricity grids. Global investments in new battery manufacturing capacity are still outpacing the actual market growth. After a 20% decrease for lithium battery packs in 2024 compared to 2023, only a moderate decrease of 1 to 3% was expected in 2025. However, compared to 2024, prices were more than 9% lower at the end of 2025. According to Ember, the levelised cost of storage3 (LCOS) using Chinese equipment with hardware costs (USD 75 per kWh and USD 50 per kWh) for installation was USD 65/MWh in 2025 [33]. As LCOS only applies to the share of total solar electricity generated in a PV plant, a 30% shifting of daily solar electricity generation to the times when it is needed just adds USD 22 per MWh to the total costs of solar electricity.
Annual installations of battery storage capacity increased by 50+% in 2025, but different numbers are reported, ranging from 92 GW (247 GWh) to 117 GW (315 GWh) [34,35]. Global investments in stationary battery electricity storage were given by BNEF with USD2025 71 billion (+18%) for 92 GW of storage. USD 41.7 billion was for large-scale storage, often combined with PV or wind plants. China (47.6 GW) and the USA (13.3 GW) together installed two thirds of the new capacity.
In 2025, investments in small-scale PV systems (USD2025 244.9 billion) were higher than investments for large-scale PV plants (USD2025 191.3 billion). Total investment in PV systems decreased by 11.5%, whereas the newly installed capacity increased by 15% to 697 GWp (Fig. 3), and the cumulative capacity now exceeds 2.9 TWp according to preliminary data (Fig. 1). This is towards the upper side between conservative (630 GWp) and optimistic forecasts (706 GWp) [8,23]. Market forecasts for 2026 vary from a shrinking market to a moderate increase to around 750 GWp, which would bring the total cumulative installed PV capacity to about 3.6 to 3.7 TWp.
In 2025, China again increased its global market share and now has 49% with a cumulative installed capacity of about 1.44 TWp. The European Union share decreased by 1% to 13.9%, or 411.2 GWp, followed by the USA with 286.8 GWp (9.7%) of the total global installed PV capacity of 2.95 TWp (Fig. 1).
Absolute capacity numbers are one measure, but capacity per capita can tell more about the share photovoltaics is contributing to the national energy mix. The number of countries with more than 500 Wp per capita has increased from 31 in 2023 to 37 in 2025. Between 2022 and 2024 the world average more than doubled from 148 Wp per capita to 369 Wp per capita in 2025 (Fig. 4). To reach the IEA NZE2024 targets, the value would need to increase to 651 Wp per capita in 2030 and 1 754 Wp in 2050. For more ambitious scenarios, which aim at an energy supply fully based on renewable energy sources, up to 8 kWp per capita would be needed in 2050 [20].
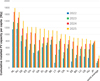 |
Fig. 4 Twenty countries with the highest cumulative photovoltaic capacity per capita in 2024 and the world average value. For comparison, earlier values are given as well (data source: [7,8] and own analysis). |
Africa
Tracking new PV capacity additions in Africa is getting more and more complicated as large-scale power PV plants are no longer the driver for solar module imports and capacity additions in Africa. According to the latest Solar Global Council Report, the utility-scale market in Africa increased by 54% to 4.498 GWac in 2025 [36]. BNEF reports that 9.2 GWp of new solar and 2.6 GW of new battery storage were added in sub-Saharan Africa in 2025 [37]. However, total solar module imports into Africa exceeded 18 GWp [38]. A considerable amount of these imports probably ended up in distributed and not accounted for PV installations.
Climate change and the increase in high-temperature days are accelerating the need for electricity to provide relief through air-conditioning devices. Increasing electricity demand in many African countries increases the probability of blackouts and limiting the hours of electricity availability. Decentralised solar power in combination with battery storage is widely seen as a way to dampen these effects. The rapid decline in solar system and battery costs enables more and more citizens to buy and install solar. In South Africa the residential rooftop capacity of close to 7.5 GWp exceeds the large-scale PV capacity at the end of 2025 [39].
Given these facts, it is estimated that the cumulative PV capacity in Africa grew by over 45% to reach 46.2 GWp at the end of 2025. On a per capita basis Africa is still well below the world average (368 Wp) with 35 Wp, and until now only three countries have exceeded the 100 Wp per capita threshold, namely Mauritius (122 Wp), South Africa (223 Wp), and Tunisia (167 Wp). The number of African nations which have more than 1 GWp solar PV installed increased from six in 2024 to ten (Algeria, Egypt, Kenya, Morocco, Namibia, Nigeria, Senegal, South Africa, Tanzania, and Tunisia) in 2025.
A solar PV capacity of more than 500 MWp can be found in 7 countries, and another 14 are now home to more than 100 MWp of PV capacity. In 2024, hydropower was still the largest source of renewable electricity generation (approx. 167 TWh) with 47 GW nameplate capacity (3.7 GW pumped storage) and supplies about 17% of the demand [40]. However, due to climate change, rainfall patterns have already changed. And together with rising temperatures, it already affects hydropower production and will hamper future hydropower expansion [41]. Theoretically the PV capacity installed in Africa at the end of 2025 can generate up to 75 TWh, but the continent’s vast solar resources are still underutilised. A combination of existing hydropower plants with floating PV on their reservoirs could not only help to better utilise the existing hydro resources but also enhance the economic performance of the plants as well [42]. To cover just 1% of the reservoirs’ area with floating PV could increase the electricity power output of these plants by 50%.
The World Bank’s Scaling Solar programme is one of the successful tools to finance large-scale solar PV projects in Africa and emerging economies [43]. Seven African nations, Côte d’Ivoire, Ethiopia, Madagascar, Niger, Senegal, Togo, and Zambia, have signed financing agreements, and plans in Côte d’Ivoire, Madagascar, Senegal, Togo, and Zambia have already been realised.
The Africa Development Bank (AfDB) launched the “Desert to Power” initiative in 2018. The aim of the programme is to deploy 10 GW solar power for the 250 million people in 11 countries (Burkina Faso, Chad, Djibouti, Eritrea, Ethiopia, Mali, Mauritania, Niger, Nigeria, Senegal, and Sudan) across the Sahel zone by 2030. Various solar projects as well as interconnections are currently under development [44]. Additional information was reported in last year’s edition of the snapshots [45].
Americas
In 2025, the North and South American market was stagnant, adding only 0.3 GWp more than in 2024. The modest growth in the USA (+2.5%) and the strong performance in Cuba (50 to 60 times 2024 installations, +1 to 1.2 GWp) and Mexico (+66% or +2.5 GWp) were offset by weaker markets in South America, mainly Brazil, Chile, and Columbia. The growth in the USA was driven by the rush to finish projects in 2025, before the end-of-year deadlines for federal tax credits, particularly for residential ones, but also impacting utility-scale projects [46].
On 26 November 2025, as a response to the energy crisis, the Republic of Cuba published Decree 110, which makes it mandatory for private or state-owned entities that consume more than 30 MWh of electricity or 50,000 L of fuel per month to invest in renewable energy and generate at least 50% of their energy used between 11 am and 1 pm with renewable energy sources [47]. The companies have until 2028 to comply with the degree. The Cuban National Plan called for 55 new solar PV plants with a nameplate capacity of 21.9 MWp to be connected to the grid in 2025. According to Cuban President Diaz-Canel, 49 solar PV plants were built in 2025, but Unión Eléctrica (UNE) lists only 37 of them in the energy statistics as of 14 January 2026 [48,49]. At the end of 2025 the total PV capacity (grid-connected and stand-alone) is estimated to be in the range of 1.4 to 1.6 GWp.
The three largest markets were the USA (51.1 GWp), Brazil (16.1 GWp), and Mexico (2.5 GWp). The total installed PV capacity in the Americas increased to 416 GWp, or 408 Wp per capita, which is 11% more than the world average. The USA still accounts for more than 68% of the total PV capacity in the Americas, which is only a slight reduction from the 70% level reached in 2022.
The U.S. Energy Information Administration predicts new utility PV plants of around 70 GWac to be installed in 2026 and 2027 and claims that this will increase the cumulative utility PV plant capacity by 49%. As utility PV plants account for about two thirds of the total capacity of 286.6 GWp, this indicates that the DC:AC factor for utility plants is currently 1.35 in the USA.
Market expectations for 2026 are stagnant for the Americas.
Asia and Pacific region
In 2022, China changed its national reporting system from nominal capacity to AC capacity. Now, the newly installed nominal capacity has to take into account the DC to AC overcapacity and the ratio of residential to commercial/utility-scale installations. For 2025, the National Energy Administration of China reported 315.07 GWAC of newly installed PV capacity [24]. With the assumption that about 10% are residential rooftop systems (DC:AC ∼1), 25% are commercial and industrial rooftop systems (DC:AC ∼1.25), 25% are utility without storage systems (DC:AC ∼ 1.4), and 40% are utility systems with storage (DC:AC ∼1.6 or higher), the newly installed nominal power is in the range of 420 GWp or more.
The Indian Ministry of New and Renewable Energy reported that at the end of 2025, India had a total installed solar PV capacity of 135.8 GWac [50]. During January 2026, an additional capacity of 4.8 GWac was installed. At the end of January 2026, the breakdown was ground-mounted PV systems 107.3 GWac, grid-connected rooftop systems 24.3 GWac, off-grid solar systems 5.68 GWac, and solar components of hybrid systems 3.4 GWac. According to PV Magazine, India installed 37.9 GWac in 2025 [51]. Except for ground-mounted systems, the DC:AC ratio is probably one, and for ground-mounted system, a DC:AC ratio of 1.35 was already used last year [45]. With these assumptions, India installed 47.9 GWp of new solar, an increase of 46% compared to 2024.
The tracking of solar module imports into Pakistan by Renewable First shows that until the end of FY 2025 (June 2025), 48 GWp of modules had been imported between FY 2017 and 2025 [52]. Total imports until the end of calendar year 2025 could well be in the range of 60 GWp. However, official statistics only show about 8 GWac (6.1 GWp net-metered rooftop) of solar PV systems.
It is obvious that most of the new PV capacity is either not grid-connected at all or behind the meter. Already in FY 2023, electricity sales fell and continued to do so by 2.8% in 2024 [53]. This development indicates that a growing number of people and small enterprises are either going off-grid or are generating behind the meter with a combination of already existing diesel generator sets, batteries and solar PV systems.
Due to non-existing statistics of all PV systems, the total installed PV capacity has to be estimated using the import data as a benchmark. It is assumed that Pakistan installed at least another 20 GWp in 2025.
After a 12.5% decline in 2024, the annual Australian market grew again by 5% in 2025. Malaysia, the Philippines, Saudi Arabia, Thailand, and the United Arab Emirates also saw significant market growth. Overall, the annual Asian PV market grew by 20% to 522 GWp. Total installed PV capacity at the end of 2025 was a little over 1.94 TWp, or 427 Wp per capita.
European Union
In 2025, cumulative installed solar PV capacity in the European Union (EU) exceeded 410 GWp. However, annual capacity additions became stagnant compared to 2024, indicating that the EU is no longer on track to meet the renewable energy global pledge to triple the capacity of renewable energies by 2030, as agreed by 123 countries during COP 28 in 2023 [54]. For 2026 another stagnant year or even a decline of the market is expected before the market could rebound but with lower growth rates than in the last five years.
Even with this lower growth rate, the EU Solar Energy Strategy’s target of achieving a nominal capacity of over 720 GWp (600 GWAC) by 2030 should be met [55].
Nineteen countries of the European Union have installed more than 1 GWp of new PV capacity in 2025: Germany (17.5 to 17.7 GWp), Spain (9.1 to 9.3 GWp), France (6.7 to 6.8 GWp), Italy (5.0 to 5.2 GWp), Netherlands (2.0 to 2.2 GWp), Poland (3.6 to 3.8 GWp), Greece (2.6 to 2.8 GWp), Romania (2.4 to 2.5 GWp), Austria, and Bulgaria (1.5 to 1.7 GWp each), Portugal (1.5 to 1.6 GWp), Ireland (1.3 to 1.5 GWp), Belgium, and Finland (1.2 to 1.3 GWp each), Denmark (1.2 to 1.4 GWp), and the Czech Republic, Hungary, Lithuania, and Sweden (1.0 to 1.1 GWp each).
Already in 2024, renewable power generation capacity had surpassed fossil fuels and nuclear combined with 712 GWAC vs 419 GWAC, accounting for 46.9% of the net electricity in the EU [56,57]. Wind provided the largest share (18.3%), followed by hydro (14.0%) and solar (10.5%). Solar PV electricity generation increased by 54 TWh or 21.7% in 2024. Since 2008, solar electricity generation has increased from 7.4 TWh to 304 TWh in 2024, roughly 13% more than the electricity generated from coal (269 TWh).
Falling battery storage costs are reshaping the outlook for how much grid expansion is needed to accommodate additional PV capacity. The European Network of Transmission System Operators for Electricity (ENTSO-E) estimates that up to 2050, EUR 863 billion is needed to meet the carbon-neutral electricity system [58]. There are other EU estimates up to EUR 2 trillion [59]. The investment cost difference is huge depending on the assumptions, and the change in the grid costs the consumers will have to pay will also be affected. The EU Agency for Cooperation of Energy Regulators [60] estimates a 60% increase in the grid costs (from 32 to 51 EUR/MWh) even in conservative scenarios. The share of storage capacities and bringing renewable capacities closer to the demand will have a great impact on the grid upgrade, and by this, on the final consumer prices.
In October 2025, the European Commission published the final Terms and Conditions (T&Cs) for its first European-wide auction for decarbonising industrial process heat [61]. The auction opened in December 2025 with a budget of approximately EUR 1 billion.
Progressive net zero energy transition scenarios show that solar photovoltaic power generation capacity needs to increase up to 8.3 TWp in Europe (EU + Albania, Kosovo, Iceland, North Macedonia, Norway, Moldova, Serbia, Turkey, Ukraine, and the United Kingdom) for a transition of the energy system to a sustainable 100% renewable energy supply [19,25]. Taking the United Nations population predictions for 2050 (675 million), the required PV capacity per capita would be 12.3 kWp by 2050 [62]. For the European Union, which at the end of 2025 had an average of 922 Wp per capita, this would necessitate a roughly 12.5-fold increase in capacity during the next 25 ys. So far eight countries are above the EU average and have already more than 1 kWp per capita installed (Fig. 5).
4 Conclusions
Since the invention of the modern solar cell at Bell Laboratories in 1954, it took 58 yr to install the first TWp of photovoltaics (2022). In less than 3 yr (2Q 2022–4Q 2024), the second TWp was installed, and at the end of 2025, the capacity had almost or even reached 3 TWp. The question now is: when will the annual PV market exceed 1 TWp?
Photovoltaics and wind power are the two most significant building blocks for a transformation to a sustainable and cost-effective energy system based on renewable energy sources, as shown by a comparative analysis of 100% renewable energy scenarios [63].
Regardless of differences in the chosen technology pathways, level of political ambitions, and real market developments, all scenarios predict a major growth of PV power in the coming decades. The bandwidth of scenario expectations ranges from an eightfold increase in the NZE WEO 2025 scenario (24.2 TW) to a 27-fold increase (80 TWp) in more ambitious scenarios compared to the existing capacity at the end of 2024 [6,19].
Land constraints to install the needed PV capacity are often mentioned. However, compared to the current area, which is used by about 70% of the world population, the 0.3% to 1% needed for PV installations is small [64]. In addition, large parts of the urban area as well as transport infrastructure exist, which can be utilised for PV installations, e.g., rooftops, facades, noise barriers, parking facilities, etc. [65–68]. Other land areas, which are already used for economic activities, offer an additional significant potential, e.g., abandoned mining areas, dykes, hydro dams, irrigation channels, industrial brownfields, waste dumps, etc. [69–73]. Last but not the least, novel applications like agri-photovoltaics or floating PV systems theoretically have enormous potential, but, depending on the application, still need intensive research to turn them into economically viable options [42,74,75].
Despite political headwinds in some countries, the growth of solar photovoltaic electricity generation is growing, mainly for economic reasons, as it is already the lowest-cost power source in a steadily growing number of countries. In addition, the rapid deployment possibility of photovoltaics offers relief for many people in countries with unstable electricity supplies and a rapidly increasing electricity demand due to the increasing number of heat waves. Together with decreasing battery costs, battery and solar PV systems become the preferred choice as a fast and easy way to secure a reliable electricity supply. The technical characteristics of solar photovoltaics, its modularity, and a very low CO2 footprint (based on a full life cycle analysis) make it a perfect solution for dense urban environments and a crucial pillar for realising a net zero carbon energy supply by 2050.
Despite the massive cost reductions over the last decade, photovoltaic and battery technology systems are still on a steep cost reduction curve along the whole value chain.
To realise the energy transition, our energy systems must move away from the combustion of fossil fuels as quickly as possible and electrify the energy system using renewable energy sources. However, there is still a lack of an enabling, reliable, long-term, and stable policy global framework. There are still a large number of policy actors who are not realising that the use of local renewable energy is not only helping to combat climate change by reducing CO2 emissions, but it is also an enabler for local economic activities, wealth creation, and a reduction of fossil fuel dependence, which is still a major driver of international conflicts [76,77].
All members of civil societies have to embrace the fact that more individual and societal effort is needed to realise the energy transition and to save the rapidly vanishing pathway for a maximum of a 1.5°C global temperature increase. We cannot wait and depend on politicians and energy interest groups but need to act as responsible citizens to preserve this planet for our children.
Despite the fact that already in 1856, the warming effect of CO2 for the atmosphere was discovered, too many political and business representatives still negate the devastating effects of climate change caused by using fossil fuels and are fighting to preserve the status quo [78,79]. As a reminder: in 1882, during a visit to Canada, Oscar Wilde said in a speech given in Ottawa, “The things of nature do not really belong to us, we should leave them to our children as we have received them” [80].
Disclaimer
The views expressed are based on the current information available to the author and may not in any circumstances be regarded as stating an official or policy position of the European Commission.
Funding
This study was performed under the European Commission Joint Research Centre Annual Work Programme 2025/26.
Conflicts of interest
The author declares to have no known competing financial interests or personal relationships that could have appeared to influence the work reported in this paper.
Data availability statement
Data are available on request.
Author contribution statement
A. J.-W. is the sole author.
References
- World Meteorological Organization, The State of the Global Climate Update for COP 30 (2025) [Google Scholar]
- Global renewables and energy efficiency pledge. https://www.cop28.com/en/global-renewables-and-energy-efficiency-pledge [Google Scholar]
- Climate Analytics, Tripling renewable by 2030 (2024). www.climateanalytics.org [Google Scholar]
- International Energy Agency, 2024, World Energy Outlook 2024, (OECD Publishing, Paris, 2024) [Google Scholar]
- IRENA, COP28, COP29, GRA, MoEA, Government of Brazil (2024), Delivering on the UAE Consensus: Tracking progress toward tripling renewable energy capacity and doubling energy efficiency by 2030, International Renewable Energy Agency, COP28 Presidency, COP29 Presidency, Ministry of Energy of the Republic of Azerbaijan, and Government of Brazil, Abu Dhabi [Google Scholar]
- International Energy Agency, World Energy Outlook 2025 (OECD Publishing, Paris, 2025) [Google Scholar]
- IEA PVPS, Trends in PV Applications 2025, Report IEA-PVPS T1-48:2025 (2025) [Google Scholar]
- Bloomberg New Energy Finance, 4Q 2025 Global PV Market Outlook (2025) [Google Scholar]
- Bloomberg New Energy Finance, Energy Transition Investment Trends 2026 (2026) [Google Scholar]
- Energy Transitions Commission, Financing the energy transition: how to make the money flow for a net-zero economy (2023) [Google Scholar]
- Allen & Overy, How big is the Net Zero financing gap? (2023) [Google Scholar]
- International Energy Agency, Net Zero by 2050—a roadmap for the Global Energy Sector (IEA, Paris, 2021). https://www.iea.org/reports/net-zero-by-2050 [Google Scholar]
- McKinsey & Company, The net-zero transition (2022) [Google Scholar]
- S. Black, W. Celinak, A. Garcia-Huitron, I. Parry, P. Schulz-Antipa, N. Vernon Lin, Underpriced and Overused: Fossil Fuel Subsidies Data 2025 Update, IMF working paper WP/25/270 (IMF, Washington, DC, 2025) [Google Scholar]
- International Energy Agency, World Energy Investment 2025 (IEA, Paris, 2025) [Google Scholar]
- S. Khalili, C. Breyer, Review on 100% renewable energy system analyses: a bibliometric perspective, IEEE Access 10, 125792 (2022). https://doi.org/10.1109/ACCESS.2022.3221155 [CrossRef] [Google Scholar]
- M.Z. Jacobson et al., Low-cost solutions to global warming, air pollution, and energy insecurity for 145 countries, Energy Environ. Sci. 15, 3343 (2022). https://doi.org/10.1039/D2EE00722C [CrossRef] [Google Scholar]
- S. Teske (ed.), Achieving the Paris Climate Agreement Goals: Global and Regional 100% Renewable Energy Scenarios with Non-energy GHG Pathways for +1.5°C and +2°C (Springer International Publishing, Cham, 2019). https://doi.org/10.1007/978-3-030-05843-2 [Google Scholar]
- N.M. Haegel, P. Verlinden, M. Victoria, P. Altermatt, H. Atwater, T. Barnes et al., Photovoltaics at multi-terawatt scale: waiting is not an option, Science 380, 39 (2023). https://doi.org/10.1126/science.adf6957 [CrossRef] [PubMed] [Google Scholar]
- D. Bogdanov, A. Gulagi, M. Fasihi, C. Breyer, Full energy sector transition towards 100% renewable energy supply: Integrating power, heat, transport and industry sectors including desalination, Appl. Energy 283, 116273 (2021). https://doi.org/10.1016/j.apenergy.2020.116273 [CrossRef] [Google Scholar]
- D. Bogdanov, M. Ram, S. Khalili, A. Aghahosseini, M. Fasihi, C. Breyer, Effects of direct and indirect electrification on transport energy demand during the energy transition, Energy Policy 192, 114205 (2024). https://doi.org/10.1016/j.enpol.2024.114205 [CrossRef] [Google Scholar]
- SMA, Oversizing Whitepaper (SMA, 2018). https://cdn.sma.de/fileadmin/content/global/docs/oversizing/Whitepaper_Oversizing_EN_180530_01.pdf?v=1652187056 [Google Scholar]
- InfoLink Consulting, Solar PV supply chain: 2026 marks the industry trough and the beginning of restructuring (2026). https://www.infolink-group.com/energy-article/solar-topic-solar-pv-supply-chain-marks-industry-trough-the-beginning-restructuring [Google Scholar]
- National Energy Administration, National power industry statistics for 2025 (2026). https://www.nea.gov.cn/20260129/6874f211acd0417eab7ac10c3061a7c2/c.html [Google Scholar]
- C. Breyer et al., Reflecting the energy transition from a European perspective and in the global context – Relevance of solar photovoltaics benchmarking two ambitious scenarios, Prog. Photovolt. Res. Appl. 31, 1369 (2022). https://doi.org/10.1002/pip.3659 [Google Scholar]
- M. Victoria et al., Solar photovoltaics is ready to power a sustainable future, Joule 5, 1 (2021). https://doi.org/10.1016/j.joule.2021.03.005 [Google Scholar]
- K. Alberi et al., Historical and future learning for the new era of multi-terawatt photovoltaics, Nat. Energy 11, 38 (2025). https://doi.org/10.1038/s41560-025-01929-z [Google Scholar]
- Bloomberg New Energy Finance, LCOE update 2026 (BloombergNEF, 2026) [Google Scholar]
- W. Mackenzie, Renewable levelized cost of electricity competitiveness reaches new milestone across global markets in 2025 (2025) [Google Scholar]
- C. Therkelsen, D. Hernandez Diaz, H. Tai, I. Ures, How might tariffs affect the energy transition?, McKinsey & Company (2025) [Google Scholar]
- E. Vartiainen, G. Masson, C. Breyer, D. Moser, E. Román Medina, Impact of weighted average cost of capital, capital expenditure, and other parameters on future utility-scale PV levelised cost of electricity, Prog. Photovolt. Res. Appl. 28, 439 (2019). https://doi.org/10.1002/pip.3189 [Google Scholar]
- S. Szabo, A. Jäger-Waldau, More competition: threat or chance for financing renewable electricity?, Energy Policy 36, 1436 (2008). https://doi.org/10.1016/j.enpol.2007.12.020 [CrossRef] [Google Scholar]
- Ember, How cheap is battery storage?, 11 December 2025 [Google Scholar]
- Bloomberg New Energy Finance, Global Energy Storage Boom: Three Things to Know, 21 October 2025 [Google Scholar]
- Discovery Allert, Global BESS demand surges 450 GWh in 2026 energy revolution (2026). https://discoveryalert.com.au/battery-storage-boom-2026-economic-forces/ [Google Scholar]
- Global Solar Council, Africa Market Outlook for Solar PV 2026-2029 (2026) [Google Scholar]
- Bloomberg New Energy Finance, Sub-Saharan Africa’s energy transition: 5 things to watch in 2026 (2026) [Google Scholar]
- Taiyang News, Africa’s solar market accelerates sharply in 2025, adding 4.5 GW (2026) [Google Scholar]
- Ecofin Agency, South Africa sees strong rise in private renewable investment (2025) [Google Scholar]
- International Hydropower association, 2025 Hydro Power Outlook (2025) [Google Scholar]
- International Energy Agency, Climate Risks to African Hydropower (IEA, Paris, 2020). https://www.iea.org/reports/climate-impacts-on-african-hydropower/climate-risks-to-african-hydropower [Google Scholar]
- R. Gonzalez Sanchez et al., Assessment of floating solar photovoltaics potential in existing hydropower reservoirs in Africa, Renew. Energy 169, 2687 (2021). https://doi.org/10.1016/j.renene.2021.01.041 [Google Scholar]
- World Bank, Scaling Solar Programme. https://www.scalingsolar.org/ [Google Scholar]
- African Development Bank, Dessert to Power—5 yr on, Annual Report 2024 (2025) [Google Scholar]
- A. Jäger-Waldau, Snapshot of photovoltaics—March 2025, EPJ Photovolt. 16, (2025). https://doi.org/10.1051/epjpv/2025012 [Google Scholar]
- United States Congress, H.R.1—an act to provide for reconciliation pursuant to title II of H. Con. Res. 14. 119th Congress (2025–2026). https://www.congress.gov/bill/119th-congress/house-bill/1/text [Google Scholar]
- Ministerio de Justica, Decreto 110/2024 “Regulaciones para el Control y Uso Eficiente de los Portadores Energéticos y las Fuentes Renovables de Energía” (GOC-2024-648-O115), Gaceta Oficial de la República de Cuba, Edivión Ordinaria La Habana, Martes (2024) [Google Scholar]
- Struggle— La Lucha, Cuba responds to U.S. oil blockade with energy self-sufficiency plan (2026). https://www.struggle-la-lucha.org/2026/02/06/cuba-responds-to-u-s-oil-blockade-with-energy-self-sufficiency-plan/ [Google Scholar]
- R. Torres, private communication (2026) [Google Scholar]
- Ministry of New and Renewable Energy, Programme/Scheme wise Cumulative Physical Progress as on 31st January 2026 (Government of India, 2026). https://mnre.gov.in/en/physical-progress/ [Google Scholar]
- PV Magazine, India deploys 37.9 GW of solar in 2025 (2026) [Google Scholar]
- Renewables First, Tracking global solar trade and Pakistan’s imports (2026). https://peci.renewablesfirst.org/solar-tracker [Google Scholar]
- Renewables First, Pakistan Electricity Review 2025 (2025). https://uploads.renewablesfirst.org/Pakistan_Electricity_Review_2025_89f0b613d6.pdf [Google Scholar]
- Global renewables and energy efficiency pledge, 2023. https://www.cop28.com/en/global-renewables-and-energy-efficiency-pledge [Google Scholar]
- European Commission, Solar Strategy Communication, COM(2022) 221 final (2022) [Google Scholar]
- Eurelectric, Capacity—electricity generation by fuel (2025). https://electricity-data.eurelectric.org/capacity.html [Google Scholar]
- Eurostat, Electricity from renewable sources reaches 47% in 2024 (2025). https://ec.europa.eu/eurostat/web/products-eurostat-news/w/ddn-20250319-1 [Google Scholar]
- European Network of Transmission System Operators for Electricity (ENTS)-E), TYNDP 2024: opportunities for a more efficient European power system by 2050 (2025) [Google Scholar]
- European Court of Auditors, Making the EU electricity grid fit for net-zero emissions, Review 01/2025 (2025) [Google Scholar]
- European Union Agency for the Cooperation of Energy Regulators (ACER), Monitoring Report 2024 (2024) [Google Scholar]
- European Commission, Innovation Fund IF25 Heat Auction (2025). https://climate.ec.europa.eu/document/download/b55d8315-2eef-4618-aa4c-75f72abb4e95_en?filename=news_20251010_tc_heat_auction_en.pdf [Google Scholar]
- United Nations, World Population Prospects 2024 (2024). https://www.un.org/development/desa/pd/world-population-prospects-2024 [Google Scholar]
- C. Breyer, et al., On the history and future of 100% renewable energy systems research, IEEE Access 10, 78176 (2022). https://doi.org/10.1109/ACCESS.2022.3193402 [Google Scholar]
- M. Marconcini, et al., Outlining where humans live, the World Settlement Footprint 2015, Sci Data 7, 242 (2020). https://doi.org/10.1038/s41597-020-00580-5 [Google Scholar]
- G. Kakoulaki, et al., Mapping Europe’s rooftop photovoltaic potential with a building-level database, Nat. Energy 11, 324 (2026). https://doi.org/10.1038/s41560-025-01947-x [Google Scholar]
- G. Kakoulaki, et al., Communication on the potential of applied PV in the European Union: rooftops, reservoirs, roads (R3), EPJ Photovolt. 15, 2 (2024). https://doi.org/10.1051/epjpv/2023035 [CrossRef] [EDP Sciences] [Google Scholar]
- P. Gagnon, et al., Rooftop Solar Photovoltaic Technical Potential in the United States: A Detailed Assessment (NREL, 2016) [Google Scholar]
- A. Jäger-Waldau, The untapped area potential for photovoltaic power in the European Union, Clean Technol. 2, 440 (2025). https://doi.org/10.3390/cleantechnol2040027 [Google Scholar]
- K. Wang, et al., Deploying photovoltaic systems in global open-pit mines for a clean energy transition, Nat. Sustain. 8, 1037 (2025). https://doi.org/10.1038/s41893-025-01594-w [Google Scholar]
- S. Xiao, et al., Land reuse for carbon mitigation: decarbonization potential of solar photovoltaics in China's open-pit mining areas, Land Use Policy 158, 107768 (2025). https://doi.org/10.1016/j.landusepol.2025.107768 [Google Scholar]
- K. Bódis, I. Kougias, N. Taylor, A. Jäger-Waldau, Solar photovoltaic electricity generation: a lifeline for the European coal regions in transition, Sustainability 11, 33703 (2019). https://doi.org/10.3390/su11133703 [Google Scholar]
- I. Kougias, et al., The potential of water infrastructure to accommodate solar PV systems in Mediterranean islands, Solar Energy 136, 174 (2016). https://doi.org/10.1016/j.solener.2016.07.003 [Google Scholar]
- S. Szabó, et al., A methodology for maximizing the benefits of solar landfills on closed sites, Renew. Sustain. Energy Rev. 76, 1291 (2017). https://doi.org/10.1016/j.rser.2017.03.117 [Google Scholar]
- M. Yeligeti, et al., Cropland and rooftops: the global undertapped potential for solar photovoltaics, Environ. Res. Lett. 18, 054027 (2023). https://doi.org/10.1088/1748-9326/accc47 [Google Scholar]
- N. Lee, et al., Hybrid floating solar photovoltaics-hydropower systems: benefits and global assessment of technical potential, Renew. Energy 162, 1415 (2020) [CrossRef] [Google Scholar]
- S. Romanko, Opinion—The unholy alliance: fossil fuels and war, E-International relations (2024). https://www.e-ir.info/2024/06/25/opinion-the-unholy-alliance-fossil-fuels-and-war/ [Google Scholar]
- S. Schulz, T. Bosch, L. Campbell, K. Vinke, Energy Policy Between War and Peace, German Council on Foreign Relations (DGAP Brief, 2025) [Google Scholar]
- E. Foote, Circumstances affecting the heat of sun’s rays, Am. J. Sci. 22, 382 (1856) [Google Scholar]
- J. Perlin, Following in the footsteps of Eunice Foote, the woman who in 1856 discovered global warming (EDP Science, in press) [Google Scholar]
- L. Lewis, H. Justin Smith, Oscar Wilde Discovers America 1882 (1936) [Google Scholar]
Solar cell production capacities mean the following:
In the case of wafer silicon-based solar cells, only the cells;
In the case of thin films, the complete integrated module;
Only those companies which actually produce the active circuit (solar cell) are counted;
Companies that purchase these circuits and make cells are not counted.
The global benchmark is calculated by Bloomberg New Energy Finance (BNEF) with capacity-weighted averages using their latest country estimates and country-specific weighted average cost of capital at the time of the financing date. LCOE excludes subsidies and tax credits.
The cost of shifting one MWh to another time, such as moving daytime solar to night-time.
Cite this article as: Arnulf Jäger-Waldau, Snapshot of photovoltaics—February 2026, EPJ Photovoltaics 17, 18 (2026), https://doi.org/10.1051/epjpv/2026011
All Figures
|
Fig. 1 Cumulative photovoltaic installations from 2014 to 2025 (data source: [7,8] and own analysis). |
| In the text | |
|
Fig. 2 World PV cell/thin film module production from 2014 to 2025. |
| In the text | |
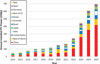 |
Fig. 3 Annual photovoltaic installations from 2014 to 2025 (data source: [7,8] and own analysis). |
| In the text | |
|
Fig. 4 Twenty countries with the highest cumulative photovoltaic capacity per capita in 2024 and the world average value. For comparison, earlier values are given as well (data source: [7,8] and own analysis). |
| In the text | |
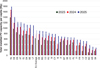 |
Fig. 5 PV capacity per capita in the EU for 2022 to 2024 (data source: [7,8] and own analysis). |
| In the text | |
Current usage metrics show cumulative count of Article Views (full-text article views including HTML views, PDF and ePub downloads, according to the available data) and Abstracts Views on Vision4Press platform.
Data correspond to usage on the plateform after 2015. The current usage metrics is available 48-96 hours after online publication and is updated daily on week days.
Initial download of the metrics may take a while.