Fig. 3
Download original image
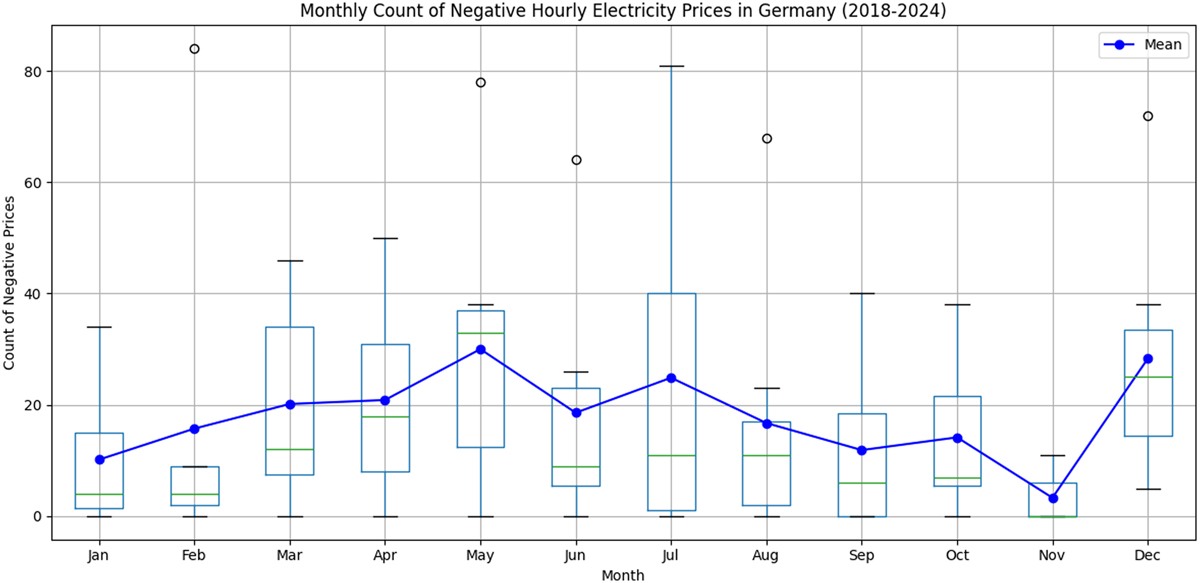
Monthly distribution of negative electricity price hours in Germany from 2018 to 2024. The graph illustrates a consistently high count and variability of negative price hours during the spring and summer months, peaking in May. In contrast, winter months show the lowest frequency and variability, indicating more stable market conditions.
Current usage metrics show cumulative count of Article Views (full-text article views including HTML views, PDF and ePub downloads, according to the available data) and Abstracts Views on Vision4Press platform.
Data correspond to usage on the plateform after 2015. The current usage metrics is available 48-96 hours after online publication and is updated daily on week days.
Initial download of the metrics may take a while.