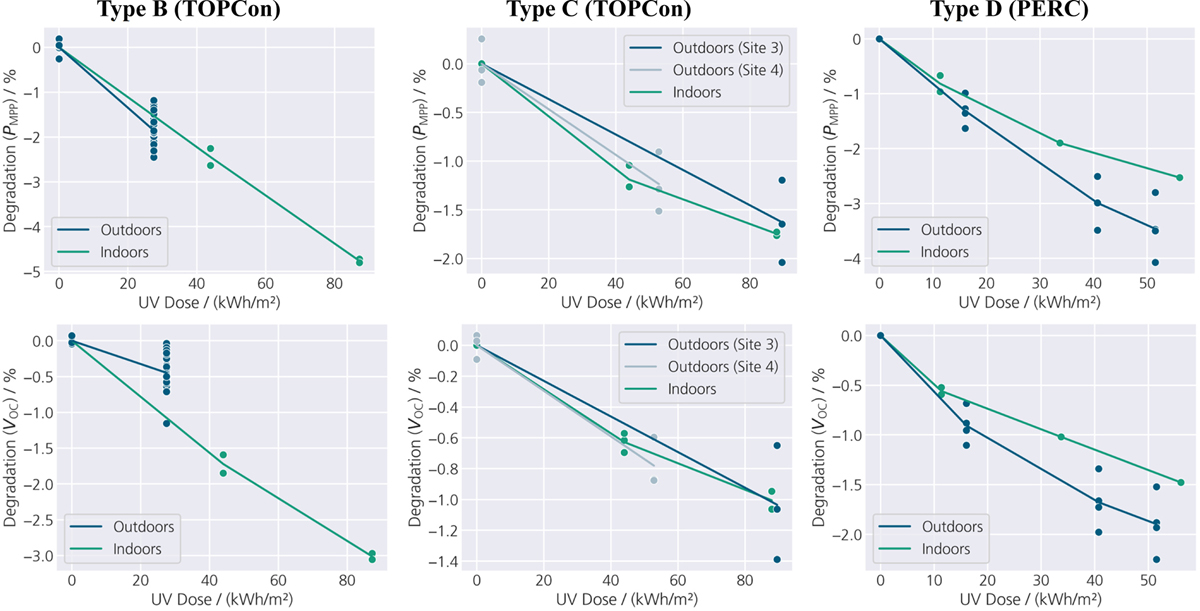
Fig. 3
Download original image
Overview on mean degradation observed in PMPP (top) and VOC (bottom) after indoor UV test (green) or outdoor exposure (blue) at four different locations: Site 2, Type B (left), Site 3 and 4, Type C (middle) and Site 5, and Type D (PERC, right). The UV dose corresponds to light ≤365 nm. Please note that the y-axes are scaled differently.
Current usage metrics show cumulative count of Article Views (full-text article views including HTML views, PDF and ePub downloads, according to the available data) and Abstracts Views on Vision4Press platform.
Data correspond to usage on the plateform after 2015. The current usage metrics is available 48-96 hours after online publication and is updated daily on week days.
Initial download of the metrics may take a while.