Fig. 2
Download original image
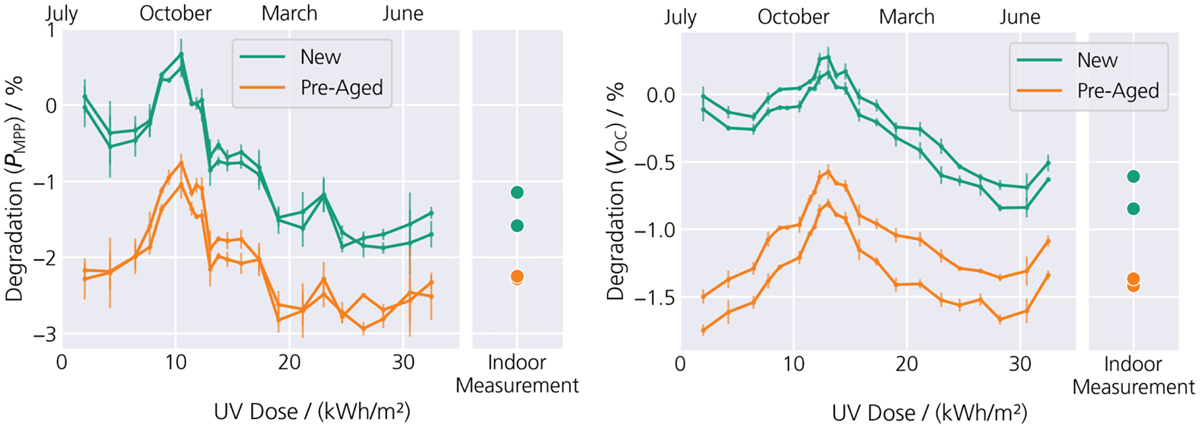
Performance evolution through the year of exposure of representative new and UV pre-aged (44 kWh/m2) PV modules of Type A: PMPP (left) and VOC (right). The UV dose corresponds to light ≤365 nm. The bars represent the standard deviation during a period of three weeks. The dots correspond to the indoor power measurements at STC after outdoor exposure.
Current usage metrics show cumulative count of Article Views (full-text article views including HTML views, PDF and ePub downloads, according to the available data) and Abstracts Views on Vision4Press platform.
Data correspond to usage on the plateform after 2015. The current usage metrics is available 48-96 hours after online publication and is updated daily on week days.
Initial download of the metrics may take a while.