Fig. 12
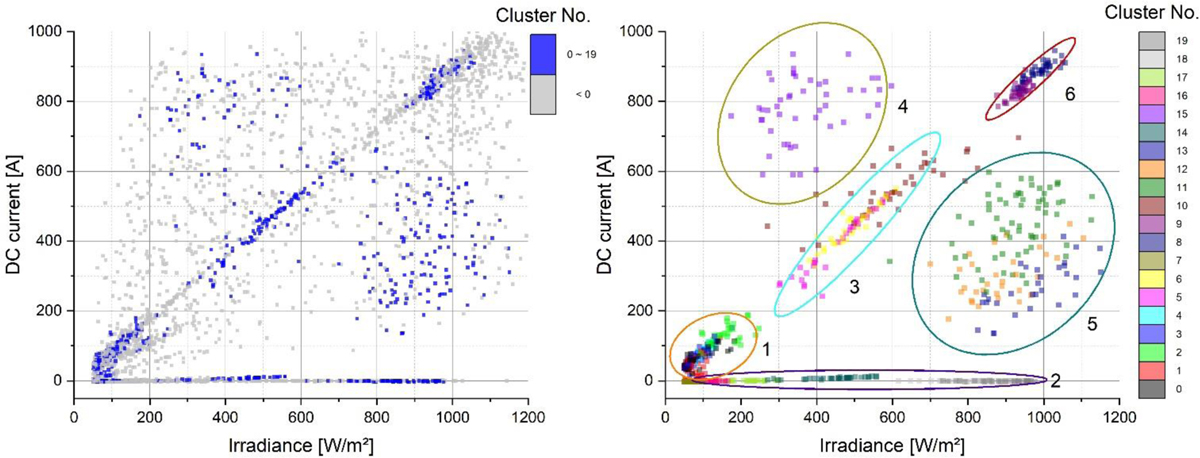
Download original image
Result of second clustering, applied to the data marked as outlier from first clustering of year 2022. The scale indicates the number of the cluster. Left: Entire dataset including outliers (gray). Right: As left, but excluding outliers and with defined cluster areas (1 to 6).
Current usage metrics show cumulative count of Article Views (full-text article views including HTML views, PDF and ePub downloads, according to the available data) and Abstracts Views on Vision4Press platform.
Data correspond to usage on the plateform after 2015. The current usage metrics is available 48-96 hours after online publication and is updated daily on week days.
Initial download of the metrics may take a while.