Fig. 11
Download original image
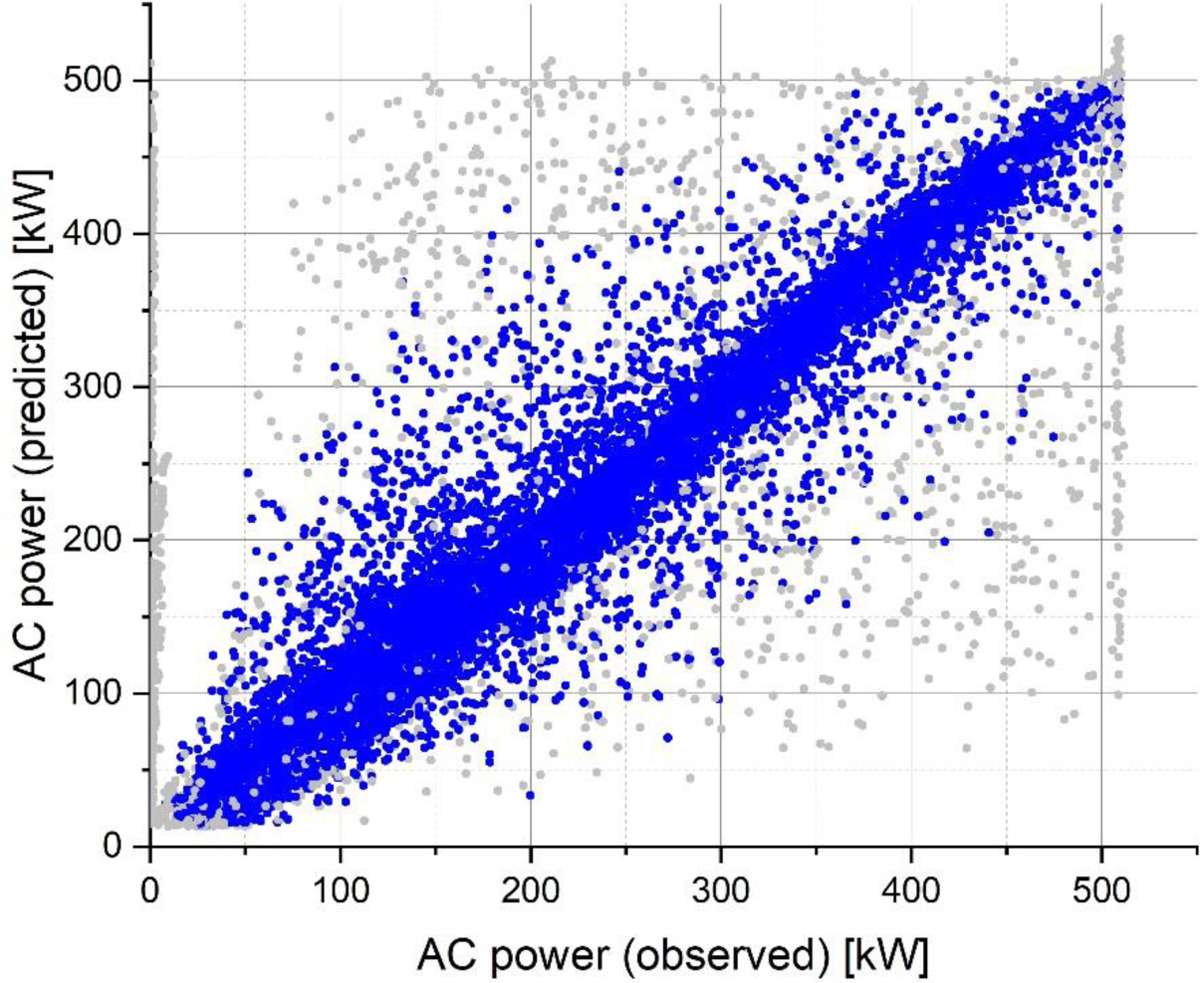
Result of 1st clustering, applied to the dataset of 2022. Blue: Main cluster representing normal inverter behaviour (89% of total dataset). Gray: Irregular behaviour or outliers (11% of total dataset).
Current usage metrics show cumulative count of Article Views (full-text article views including HTML views, PDF and ePub downloads, according to the available data) and Abstracts Views on Vision4Press platform.
Data correspond to usage on the plateform after 2015. The current usage metrics is available 48-96 hours after online publication and is updated daily on week days.
Initial download of the metrics may take a while.