Fig. 11
Download original image
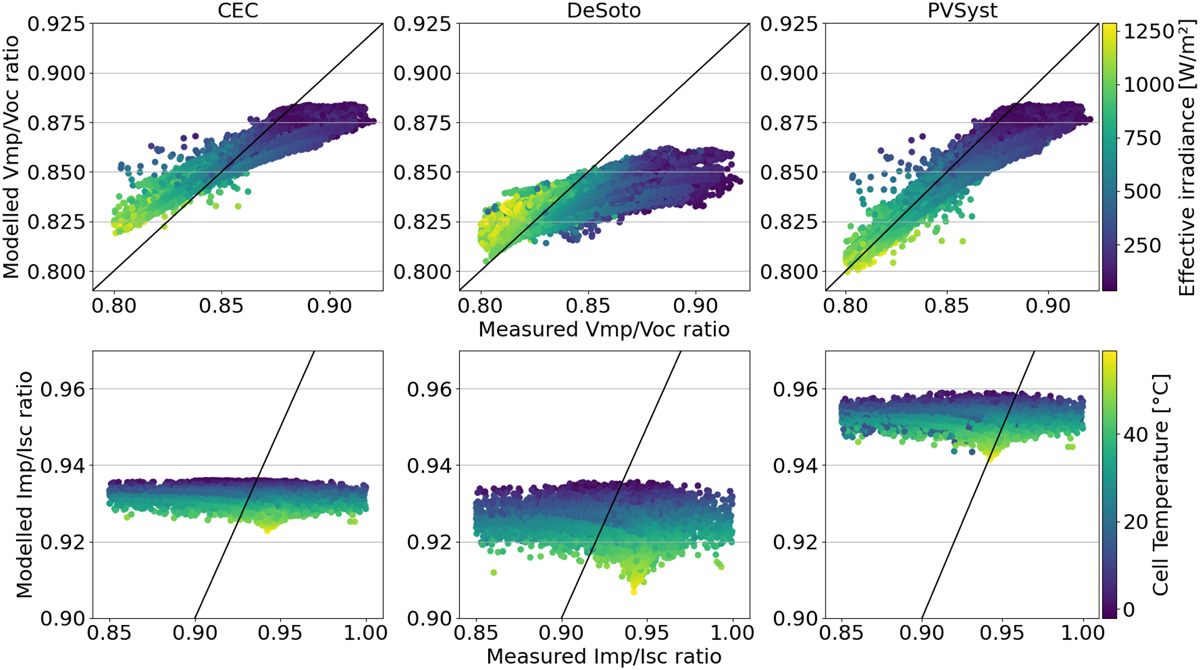
Measured versus modelled Vmp/Voc (top) and Imp/Isc (bottom) ratios. The left column displays the CEC model, the middle column shows the DeSoto model and the right column is showing the PVsyst model. Color bars show dependence on effective irradiance and cell temperature. Data shown are for module A2.
Current usage metrics show cumulative count of Article Views (full-text article views including HTML views, PDF and ePub downloads, according to the available data) and Abstracts Views on Vision4Press platform.
Data correspond to usage on the plateform after 2015. The current usage metrics is available 48-96 hours after online publication and is updated daily on week days.
Initial download of the metrics may take a while.