Fig. 1
Download original image
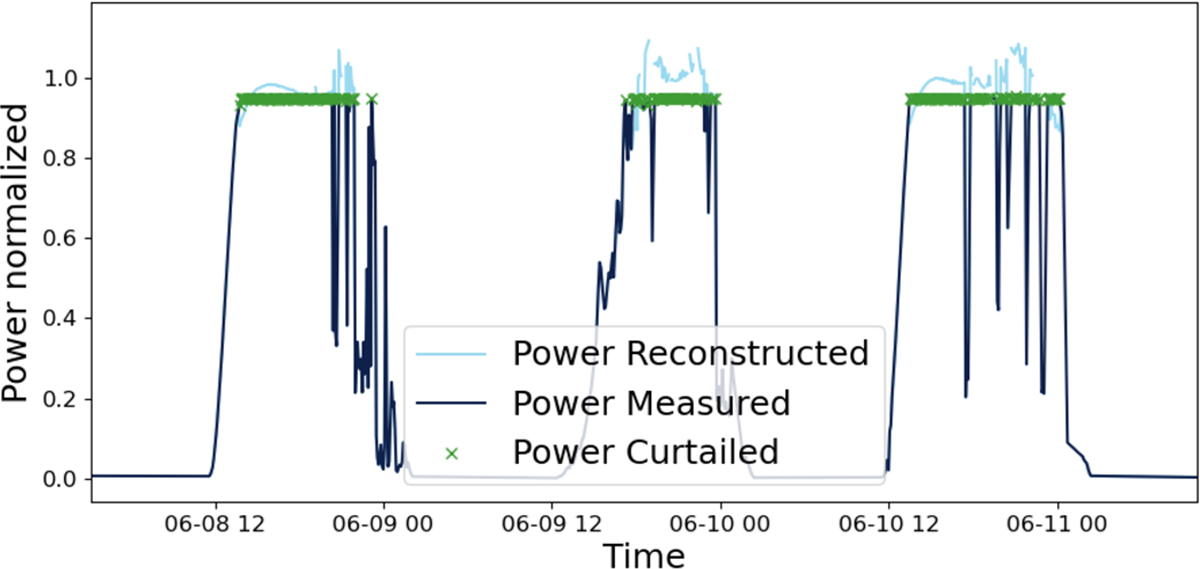
An example of power curtailment for a PV plant and its subsequent reconstruction. The blue lines represent the data collected by the system, representing the power plant's actual output. The green crosses mark the points identified for reconstruction based on the developed function, and the light blue lines represent the power points predicted by the quadratic regression. The light blue lines illustrate the anticipated power output without curtailment, providing insight into the plant's potential output when not subject to deliberate reduction.
Current usage metrics show cumulative count of Article Views (full-text article views including HTML views, PDF and ePub downloads, according to the available data) and Abstracts Views on Vision4Press platform.
Data correspond to usage on the plateform after 2015. The current usage metrics is available 48-96 hours after online publication and is updated daily on week days.
Initial download of the metrics may take a while.