


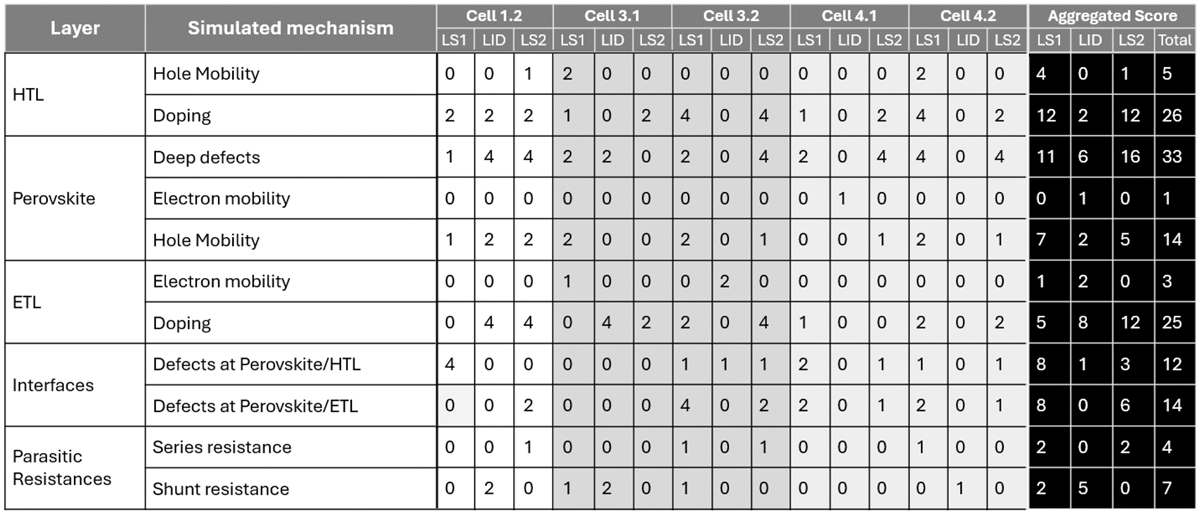
Table 1
Summary of agreement scores between experimental correlation pathways and simulated mechanisms for the five devices analysed. For each device, three adjacent columns report the scores for first light soaking (LS1), light-induced degradation (LID), second light soaking (LS2). Scores are computed as described in Section 2.3.3 and take discrete values (0, 1, 2, or 4) corresponding to increasing agreement between simulated and experimental pathways. For each mechanism and interval, the final score is obtained from considering both JSC-VOC and FF-VOC correlation pathways. Device labels follow the split-group nomenclature defined in Section 2.1, column shading indicates split groups, and the corresponding processing conditions are summarised in Table S1. The rightmost columns report aggregated scores across devices for each phase and the overall total.
Current usage metrics show cumulative count of Article Views (full-text article views including HTML views, PDF and ePub downloads, according to the available data) and Abstracts Views on Vision4Press platform.
Data correspond to usage on the plateform after 2015. The current usage metrics is available 48-96 hours after online publication and is updated daily on week days.
Initial download of the metrics may take a while.