


Fig. 6
Download original image
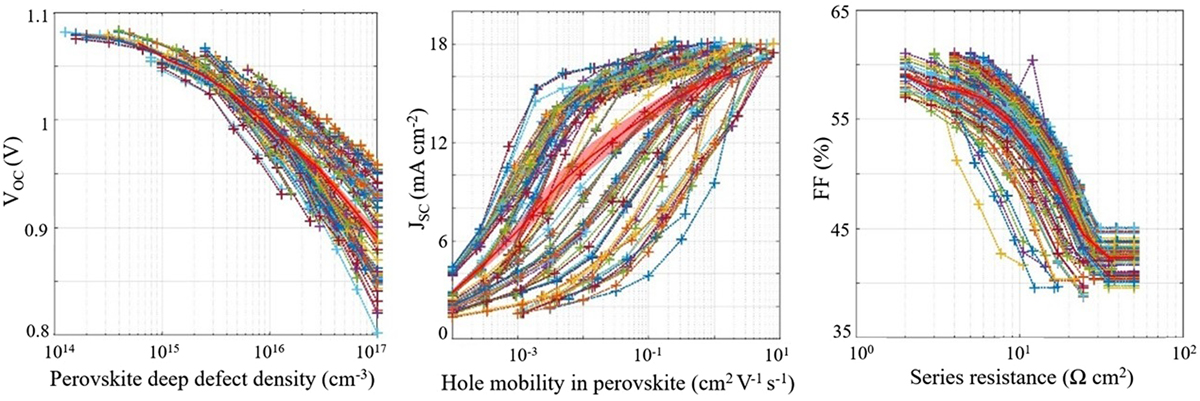
Evolution of VOC, JSC, and FF for simulated degradation mechanisms among the cells studied. (a) Formation of deep defects in the perovskite, (b) reduction of hole mobility in the perovskite, (c) increase of series resistance. For each case, ∼100 evolutions are simulated. The average is shown in red, and the shaded area represents the 95% confidence interval. The isolated spike in panel (c) arises from a single simulation (numerical artefact) and does not affect the mean trend.
Current usage metrics show cumulative count of Article Views (full-text article views including HTML views, PDF and ePub downloads, according to the available data) and Abstracts Views on Vision4Press platform.
Data correspond to usage on the plateform after 2015. The current usage metrics is available 48-96 hours after online publication and is updated daily on week days.
Initial download of the metrics may take a while.