


Fig. 5
Download original image
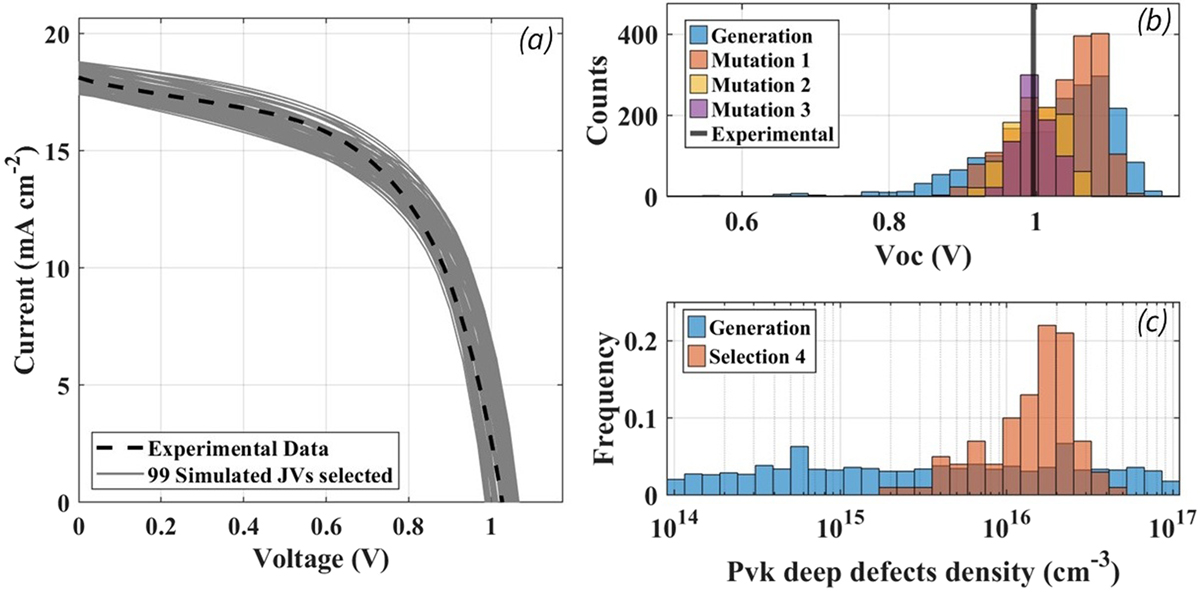
(a) Representation of the experimental JV curve (black dashed lines) and the 99 simulated JV curves (grey) after the 8th step of the GA for LS2 of Cell 3.1. (b) Distributions of VOC at different stages of the GA. As new sets are generated, electrical parameters evolve towards the experimental value (vertical black line). (c) Example of material parameters distribution for the defects in the perovskite layer. Analysing the material parameter distribution at the end of the GA can offer insights into parameters that may be unknown or not easily measured experimentally.
Current usage metrics show cumulative count of Article Views (full-text article views including HTML views, PDF and ePub downloads, according to the available data) and Abstracts Views on Vision4Press platform.
Data correspond to usage on the plateform after 2015. The current usage metrics is available 48-96 hours after online publication and is updated daily on week days.
Initial download of the metrics may take a while.