


Fig. 4
Download original image
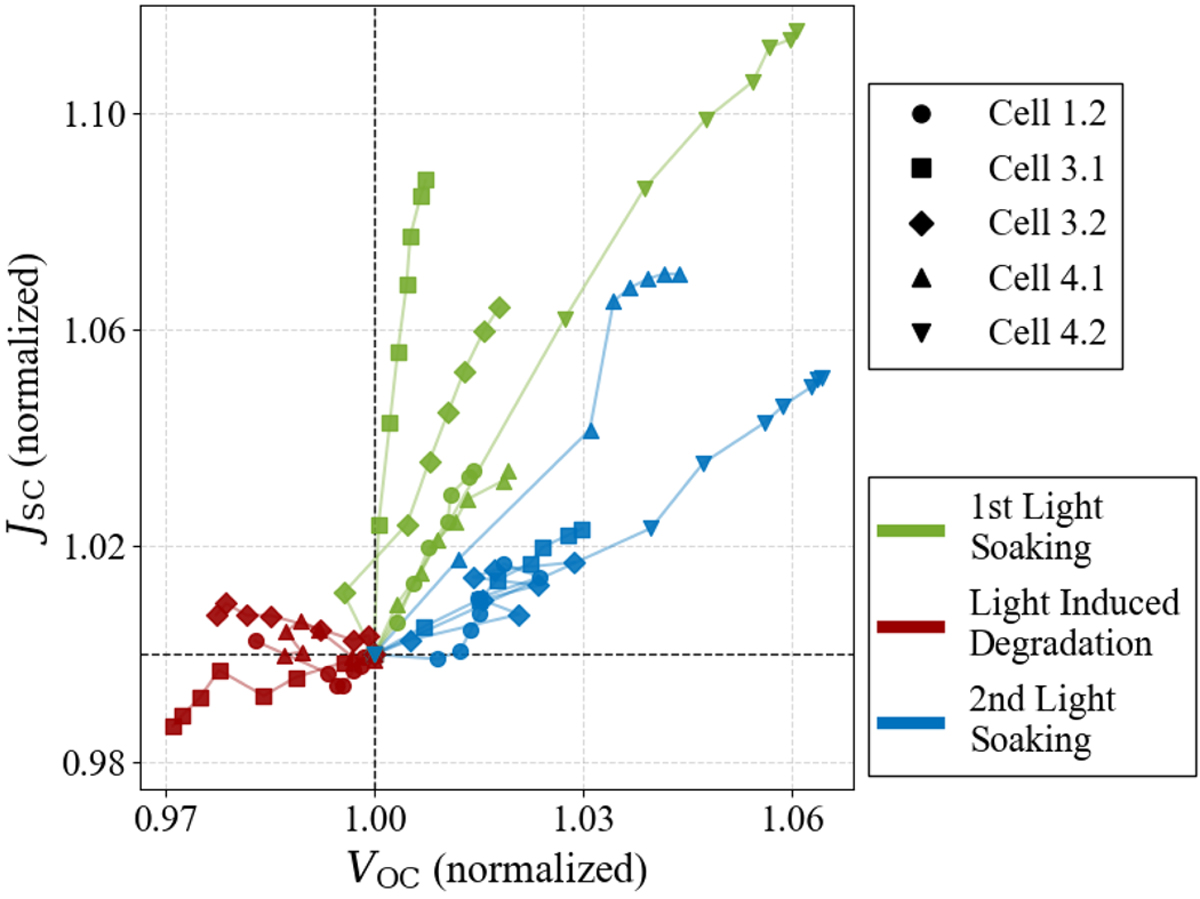
Normalized VOC-JSC experimental correlation pathways of solar cells during ageing, smoothed along time and anchored at (1,1). Line colours denote the type of evolution: LS1 (green), LS2 (blue), LID (red). Marker shapes identify each cell as in the legend. Device labels follow the split-group notation defined in Table S1.
Current usage metrics show cumulative count of Article Views (full-text article views including HTML views, PDF and ePub downloads, according to the available data) and Abstracts Views on Vision4Press platform.
Data correspond to usage on the plateform after 2015. The current usage metrics is available 48-96 hours after online publication and is updated daily on week days.
Initial download of the metrics may take a while.