


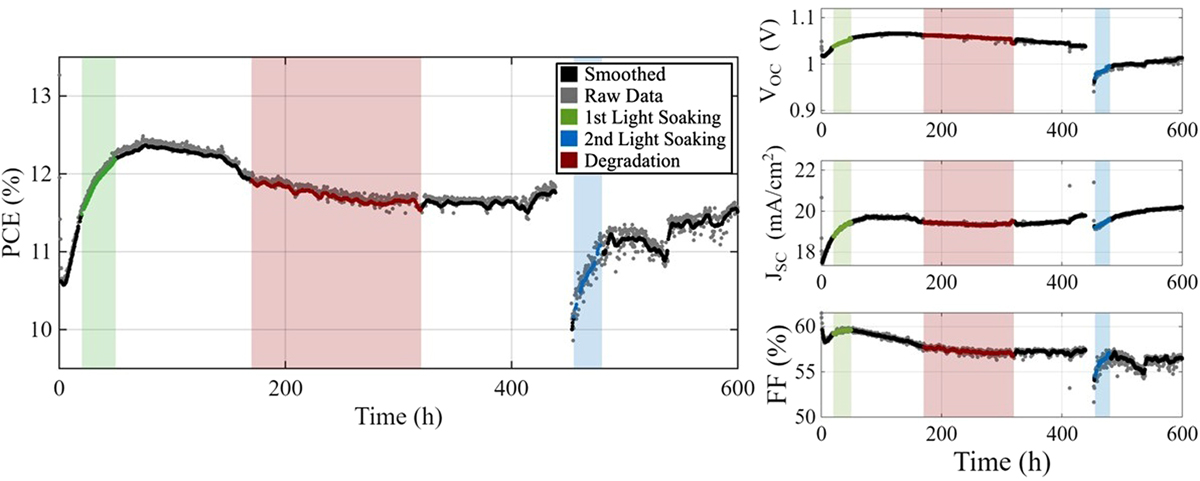
Fig. 2
Download original image
Temporal evolution of the PCE, VOC, JSC, and FF for Cell 1.2 during the first 600 h. LID happens between LS1 and LS2, LS2 occurs at t = 452 h after light interruption. Notably, simultaneous performance increase and decline are selected across all parameters, reducing the complexity of feasible mechanisms behind instabilities and making the results interpretable. An identical selection and processing procedure was applied to all cells studied.
Current usage metrics show cumulative count of Article Views (full-text article views including HTML views, PDF and ePub downloads, according to the available data) and Abstracts Views on Vision4Press platform.
Data correspond to usage on the plateform after 2015. The current usage metrics is available 48-96 hours after online publication and is updated daily on week days.
Initial download of the metrics may take a while.