


Fig. 1
Download original image
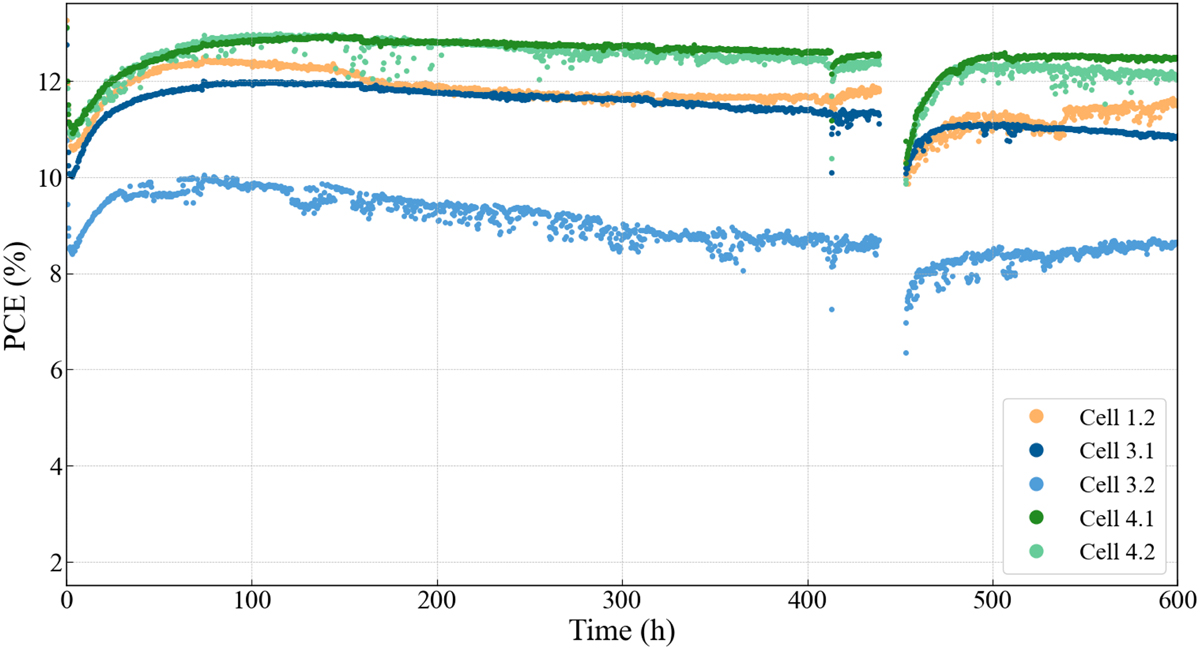
Temporal evolution of the output power for the five solar cells studied under continuous illumination at 100 mW/cm2. Light soaking (LS1, LS2) and light-induced degradation (LID) phases are observed. LS1 starts at t = 0 h, LS2 at t = 452 h after light was interrupted for 12 h, and LID occurs between them. Device labels follow the notation defined in Table S1.
Current usage metrics show cumulative count of Article Views (full-text article views including HTML views, PDF and ePub downloads, according to the available data) and Abstracts Views on Vision4Press platform.
Data correspond to usage on the plateform after 2015. The current usage metrics is available 48-96 hours after online publication and is updated daily on week days.
Initial download of the metrics may take a while.