Fig. A2
Download original image
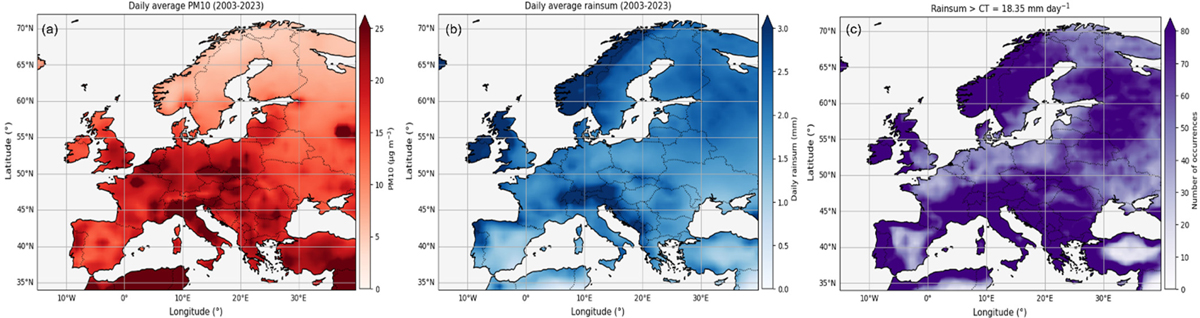
European map showing the average values for the period between 2003 and 2023 for EAC4 average PM10 concentrations (a) and ERA5 daily rain sums (b). The number of days within the considered 20-year period when the ERA5 daily rain sum estimated for each location surpassed the cleaning threshold of 18.35 mm day-1 are presented on panel (c).
Current usage metrics show cumulative count of Article Views (full-text article views including HTML views, PDF and ePub downloads, according to the available data) and Abstracts Views on Vision4Press platform.
Data correspond to usage on the plateform after 2015. The current usage metrics is available 48-96 hours after online publication and is updated daily on week days.
Initial download of the metrics may take a while.