Fig. 5
Download original image
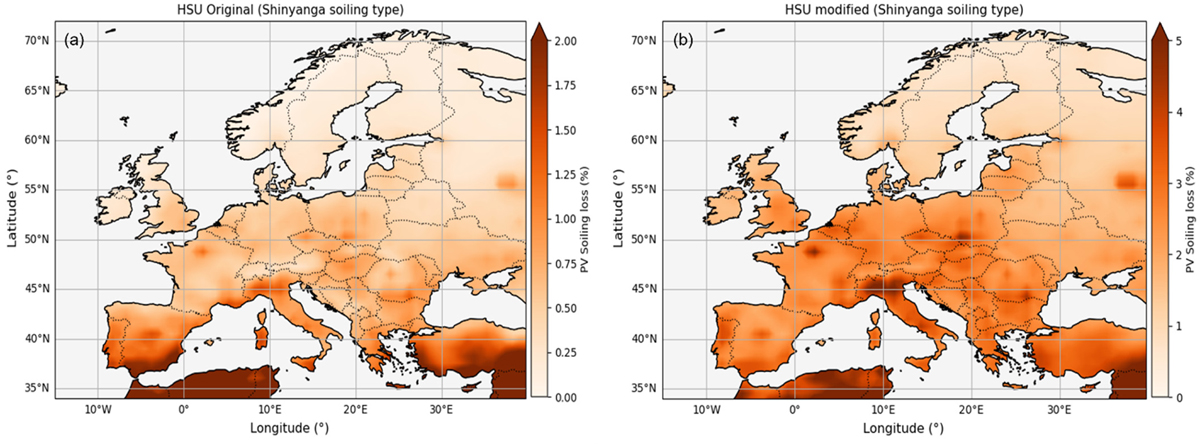
Maps of average soiling losses in Europe for PV operation without manual cleaning over 20 yr (2003–2023) using the original HSU model (a) and its modified version (b) with the corresponding parameters calibrated for the soiling type observed in Shinyanga during 2020 (see Tab. 3). The color bar limits are different for the two cases: Due to the different magnitude of the estimated soiling losses by each model, the color bar in panel (a) reaches up to 2%, whereas the color bar in panel (b) reaches up to 5%.
Current usage metrics show cumulative count of Article Views (full-text article views including HTML views, PDF and ePub downloads, according to the available data) and Abstracts Views on Vision4Press platform.
Data correspond to usage on the plateform after 2015. The current usage metrics is available 48-96 hours after online publication and is updated daily on week days.
Initial download of the metrics may take a while.