Fig. 4
Download original image
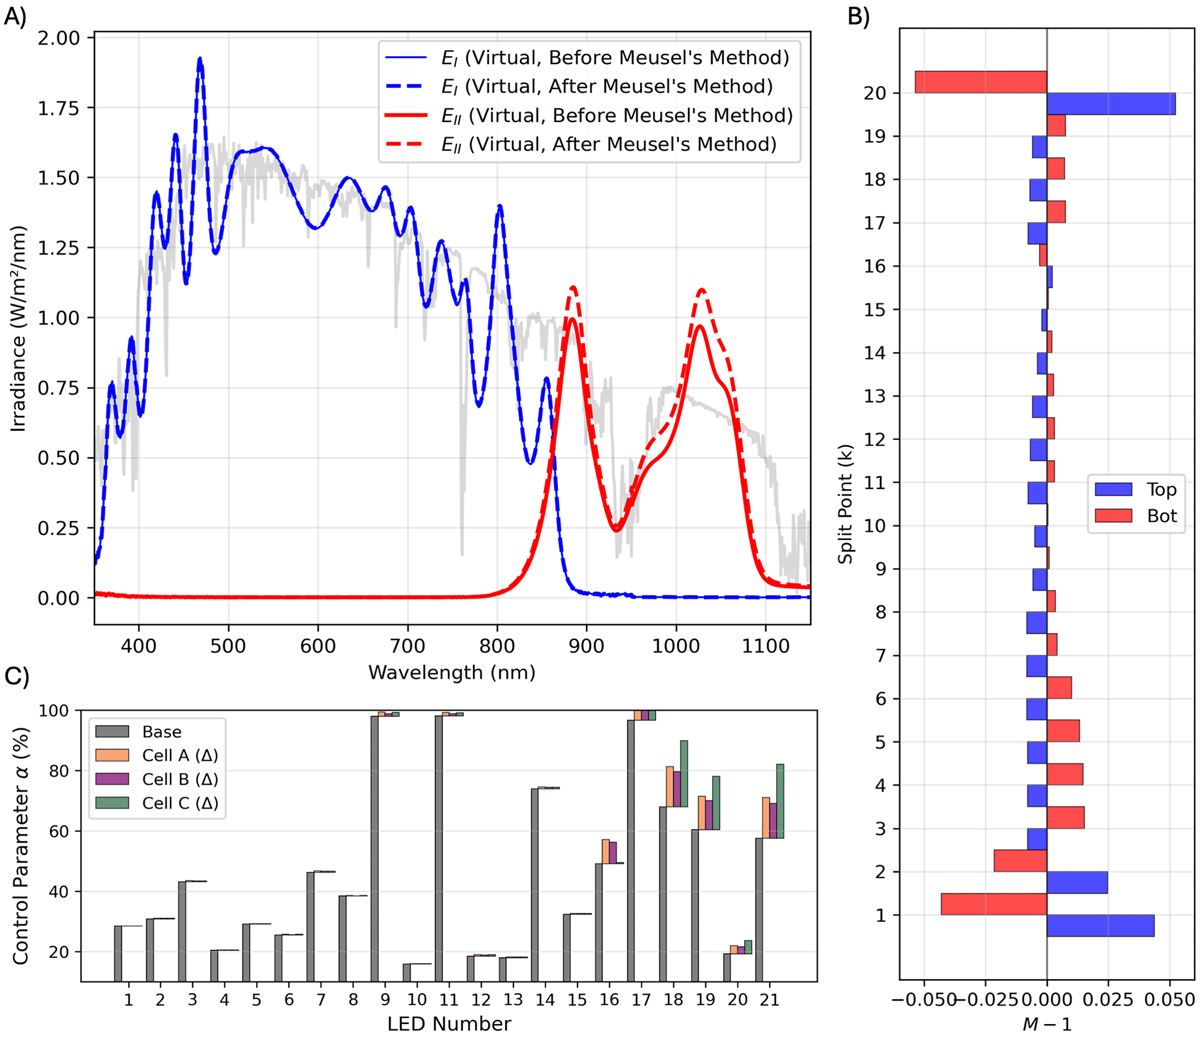
Example of steps in the calibration method for Cell A. A) Virtual lamps at k = 15. Solid lines show EI, EII of the base spectrum, whilst dashed lines show the spectrum after applying Meusel’s method. B) Mismatch factors of EMeusel,k for k∊[1, m–1]. kbest is the best splitting as it shows the lowest deviation. C) Change in {α} after calibration for Cell A, B, and C.
Current usage metrics show cumulative count of Article Views (full-text article views including HTML views, PDF and ePub downloads, according to the available data) and Abstracts Views on Vision4Press platform.
Data correspond to usage on the plateform after 2015. The current usage metrics is available 48-96 hours after online publication and is updated daily on week days.
Initial download of the metrics may take a while.