Open Access
Fig. 6
Download original image
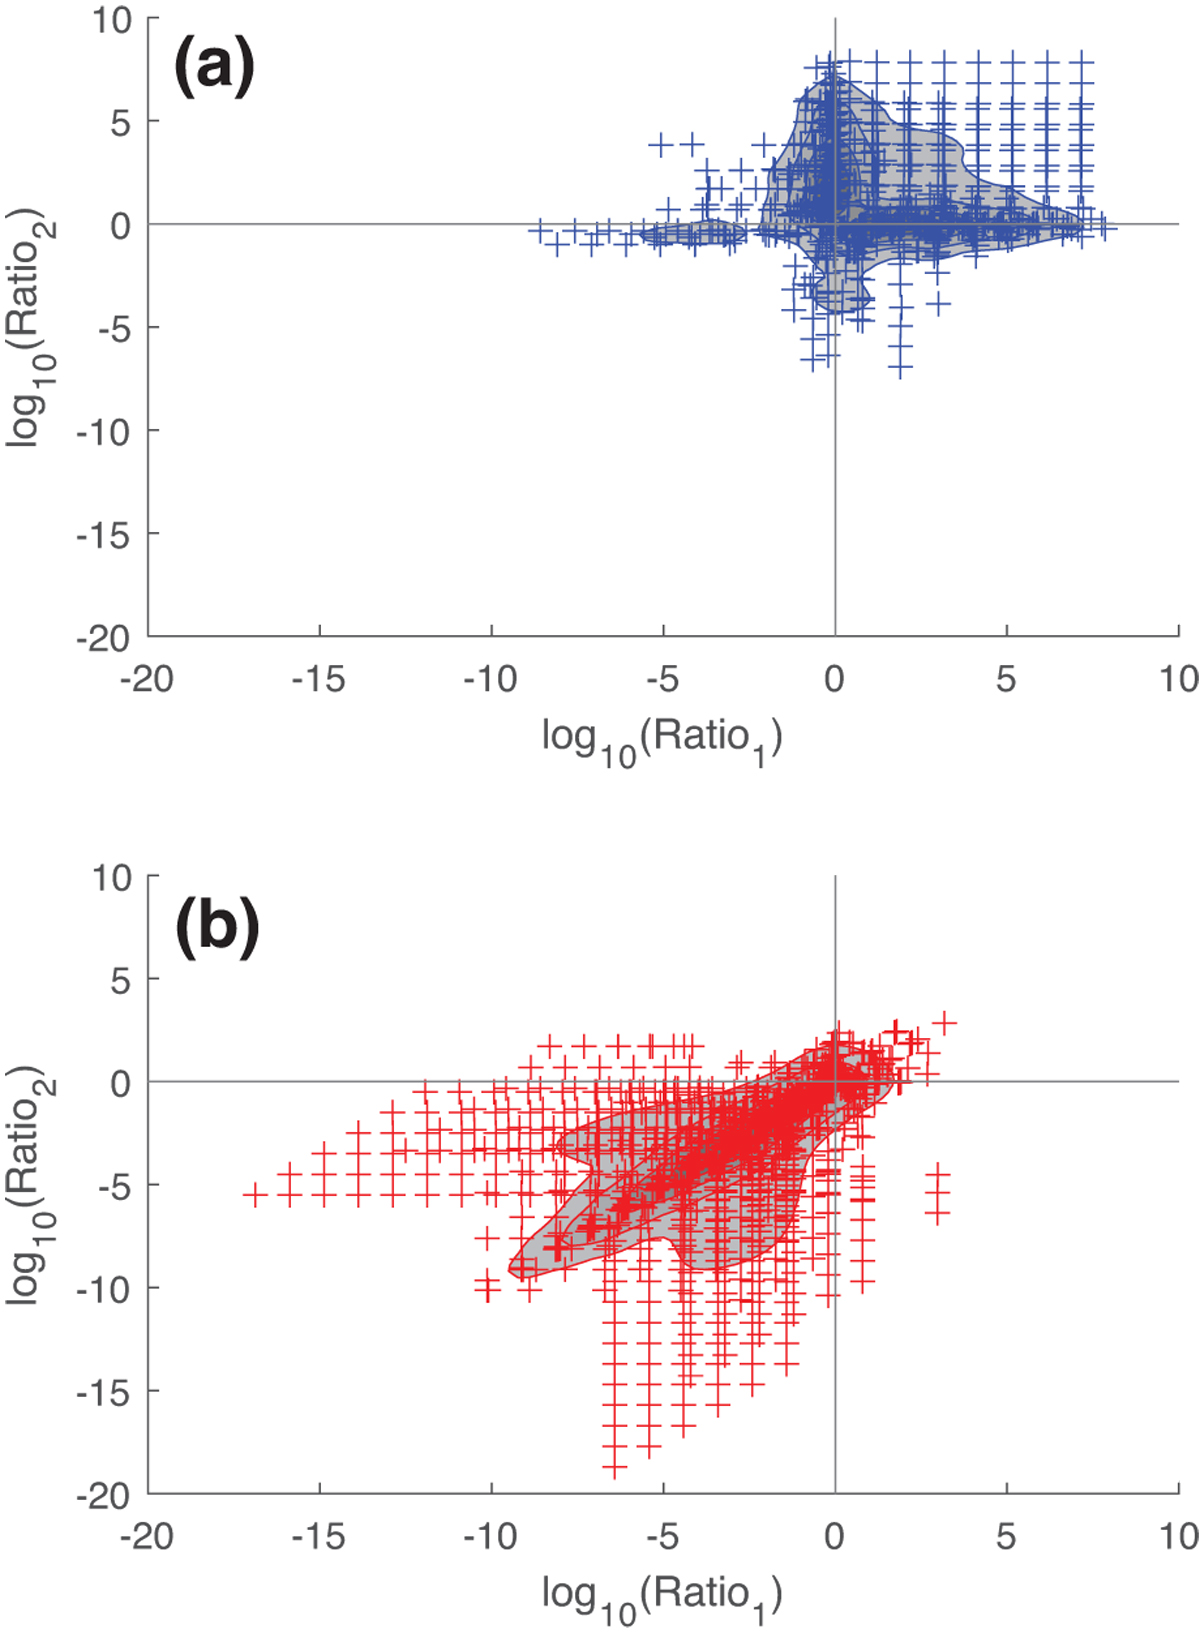
Intrinsic small signal case: appearance of (a) V-Shapes (blue crosses) and (b) Monotonic-Shapes (red crosses) with respect to Ratio1 and Ratio2. The same kernel density treatment has been used to visualize the areas with strong point densities.
Current usage metrics show cumulative count of Article Views (full-text article views including HTML views, PDF and ePub downloads, according to the available data) and Abstracts Views on Vision4Press platform.
Data correspond to usage on the plateform after 2015. The current usage metrics is available 48-96 hours after online publication and is updated daily on week days.
Initial download of the metrics may take a while.