Fig. 4
Download original image
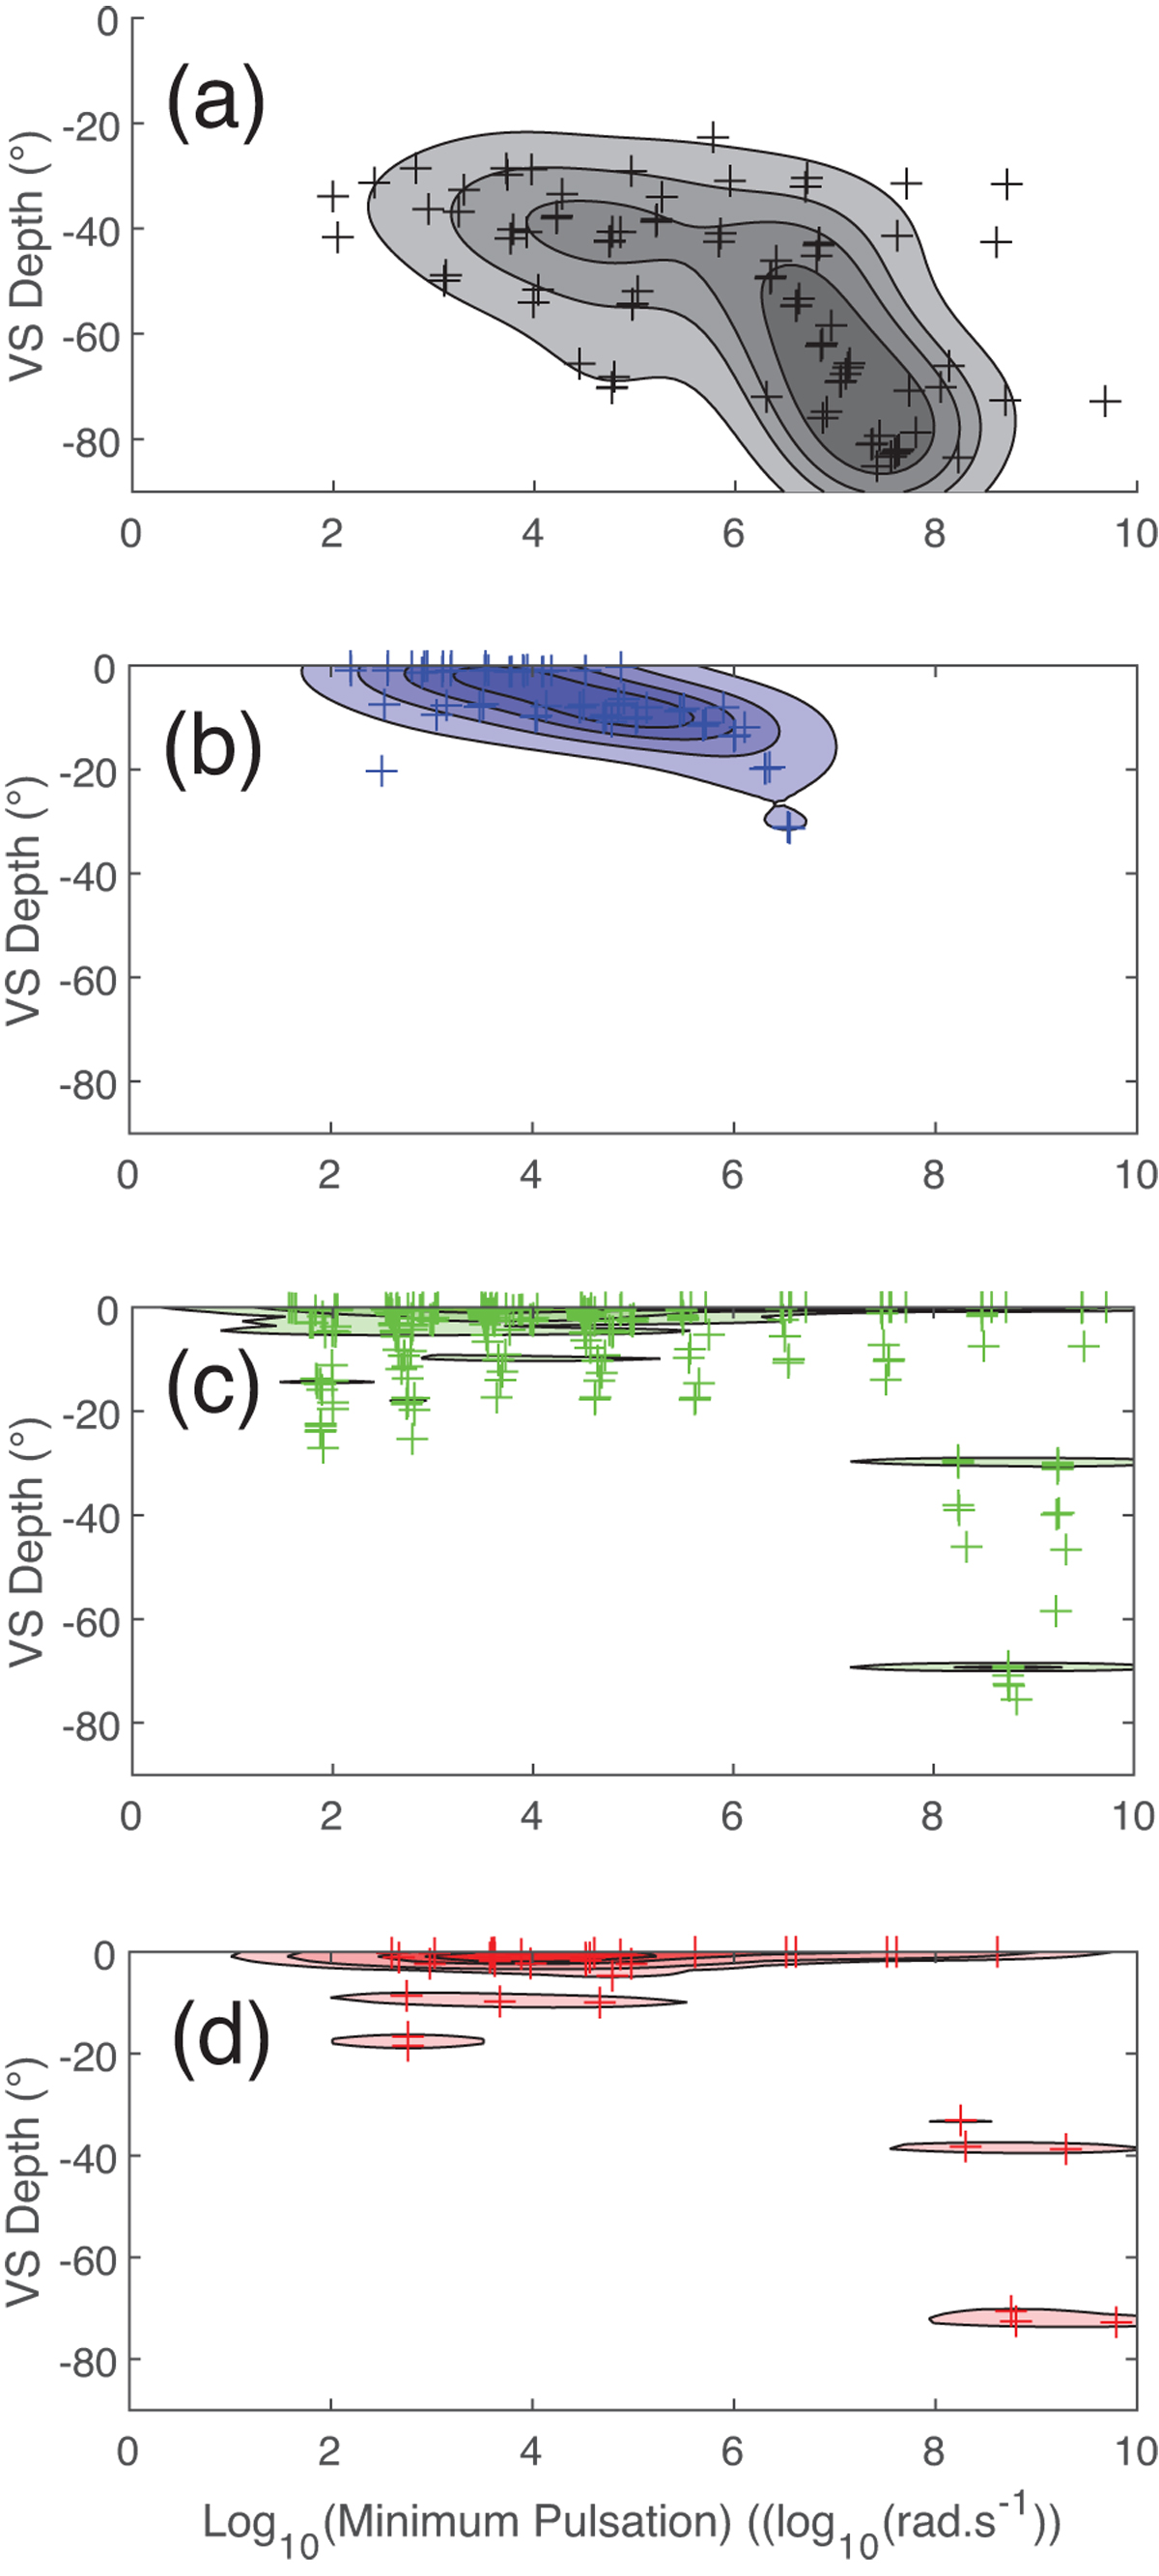
P-doped small-signal case: frequency and depth of the phase minimum of the V-Shapes for (a) V-Shape belongings to scenario 2, (b) V-Shapes belonging to scenario 1, (c) V-Shapes belonging to scenario 3, (d) V-Shapes belonging to scenario 4. A kernel density treatment has been used to visualize the areas with strong crosses densities (see details in the text). The crosses are the result of the analysis using formula (42) of numerical results for all the observed V-Shapes.
Current usage metrics show cumulative count of Article Views (full-text article views including HTML views, PDF and ePub downloads, according to the available data) and Abstracts Views on Vision4Press platform.
Data correspond to usage on the plateform after 2015. The current usage metrics is available 48-96 hours after online publication and is updated daily on week days.
Initial download of the metrics may take a while.