Open Access
Fig. 1
Download original image
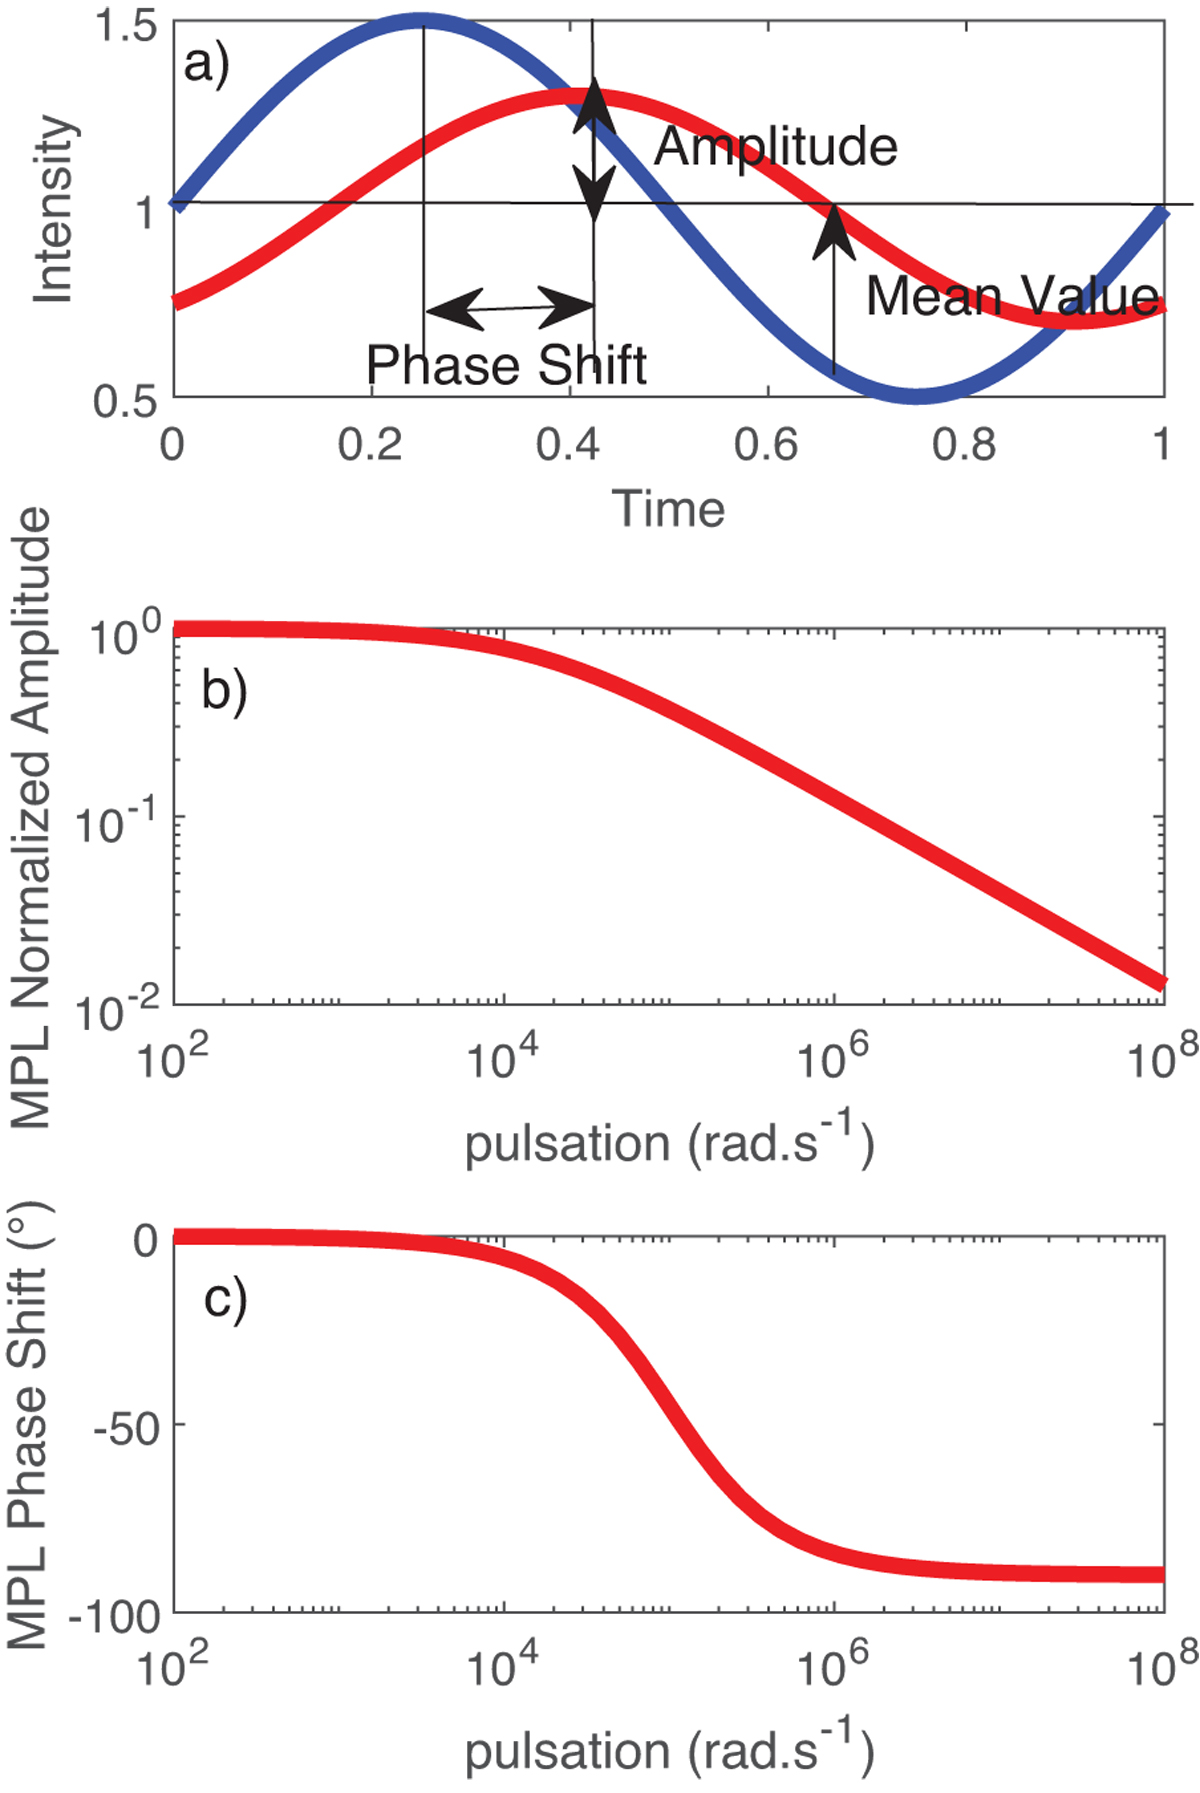
Schematic of the different steps of an MPL experiment: (a) Laser (blue line) and PL (red line) sinusoidal signals at a given pulsation presenting a phase shift. (b) Example of a monotonic amplitude Bode plot; (c) corresponding phase Bode plot.
Current usage metrics show cumulative count of Article Views (full-text article views including HTML views, PDF and ePub downloads, according to the available data) and Abstracts Views on Vision4Press platform.
Data correspond to usage on the plateform after 2015. The current usage metrics is available 48-96 hours after online publication and is updated daily on week days.
Initial download of the metrics may take a while.