Fig. 5
Download original image
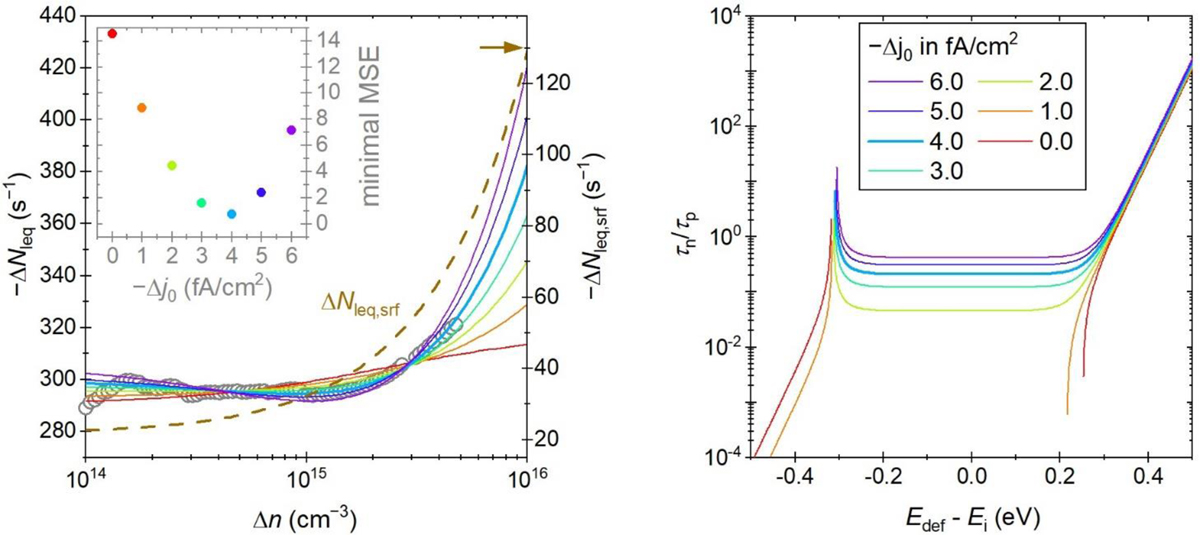
(Left): Injection-dependent (negative) lifetime equivalent defect density ΔNleq of the TR sample from Figure 3 at 1 h (compared to 0 h) and best matching SRH fit curves assuming different improvements in surface passivation quality given as (negative) Δj0. The 4.0 fA/cm2 curve corresponds to the minimal overall MSE (shown in the inset). The dashed line shows the contribution of the changed surface passivation quality to overall ΔNleq. (Right): Results of the SRH parameter surface analysis showing the combinations of τn/τp and energy level Edef (relative to the intrinsic Fermi level Ei lying close to mid-gap) that result in the lowest mean square error for the ΔNleq (Δn) data from Figure 5 (left) assuming different improvements in surface passivation quality given by (negative) Δj0. The light blue 4.0 fA/cm2 curve corresponds to the minimum overall MSE.
Current usage metrics show cumulative count of Article Views (full-text article views including HTML views, PDF and ePub downloads, according to the available data) and Abstracts Views on Vision4Press platform.
Data correspond to usage on the plateform after 2015. The current usage metrics is available 48-96 hours after online publication and is updated daily on week days.
Initial download of the metrics may take a while.