Fig. 4
Download original image
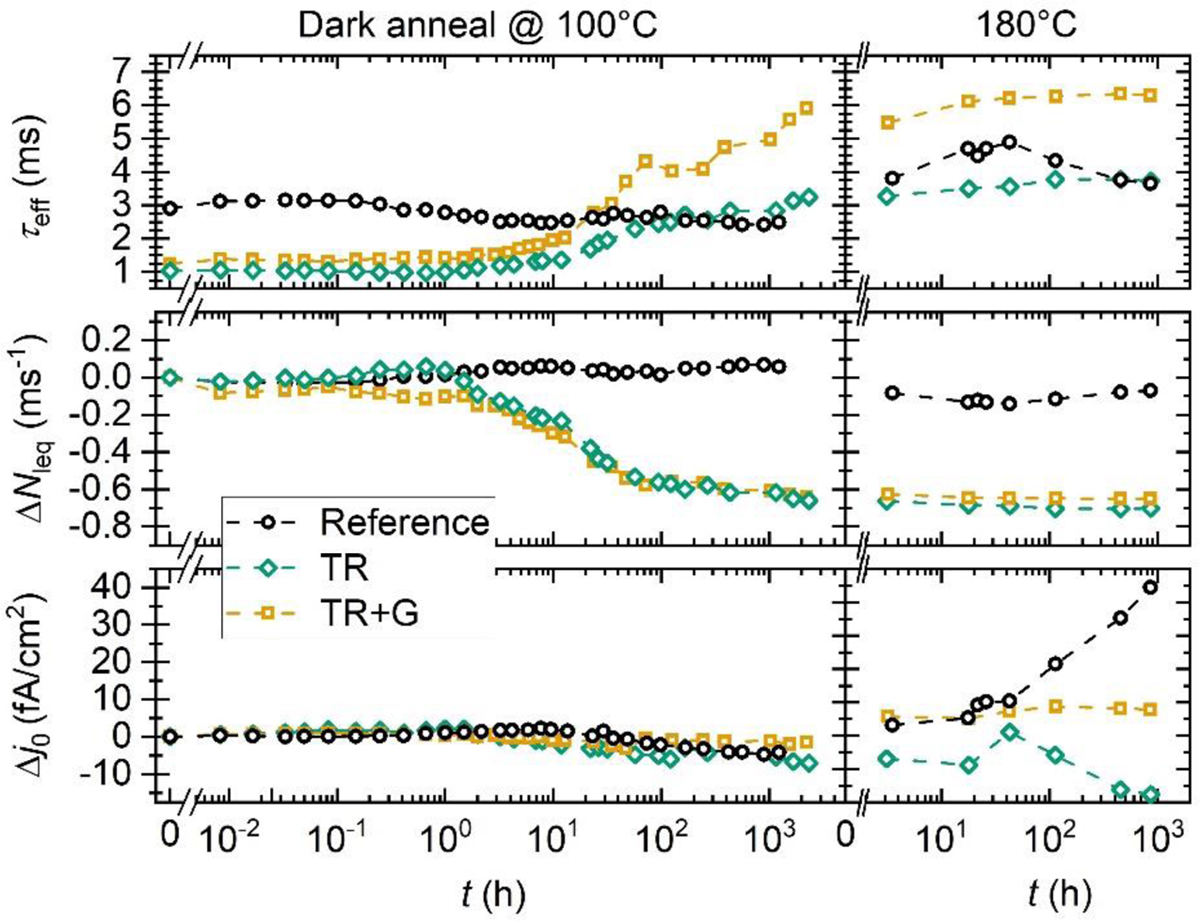
Effective lifetime τeff (top), lifetime equivalent defect density ΔNleq (middle) and change in saturation density Δj0 (bottom) versus accumulated treatment time for differently processed n-type FZ samples. Samples were degraded at 100 °C in the dark. After 1000 h, the treatment temperature is increased to 180 °C. The lines in the graphs are guide-to-the-eye.
Current usage metrics show cumulative count of Article Views (full-text article views including HTML views, PDF and ePub downloads, according to the available data) and Abstracts Views on Vision4Press platform.
Data correspond to usage on the plateform after 2015. The current usage metrics is available 48-96 hours after online publication and is updated daily on week days.
Initial download of the metrics may take a while.