Fig. 2
Download original image
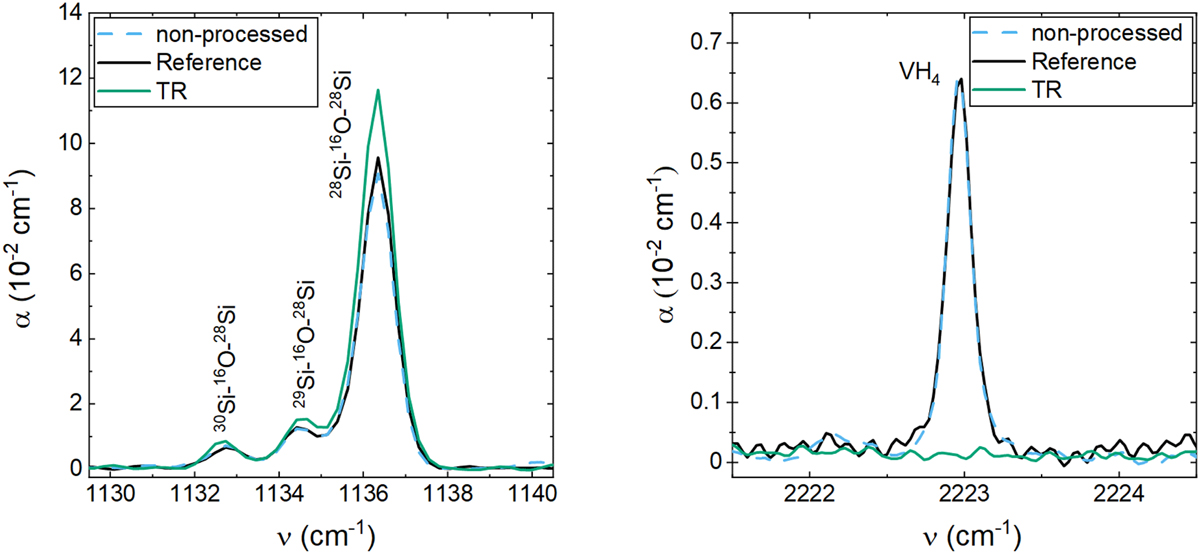
IR absorption coefficient spectra of Oi (left) at 1132-1138 cm−1 and of VH4 (right) at 2223 cm−1 for differently processed n-type FZ-Si samples. Additionally, a non-processed n-type FZ-Si sample is used as a comparison alongside the processed and fired reference sample. Since the two reference curves overlap, the line of the as-cut reference sample is dashed for better visualization.
Current usage metrics show cumulative count of Article Views (full-text article views including HTML views, PDF and ePub downloads, according to the available data) and Abstracts Views on Vision4Press platform.
Data correspond to usage on the plateform after 2015. The current usage metrics is available 48-96 hours after online publication and is updated daily on week days.
Initial download of the metrics may take a while.