Fig. 1
Download original image
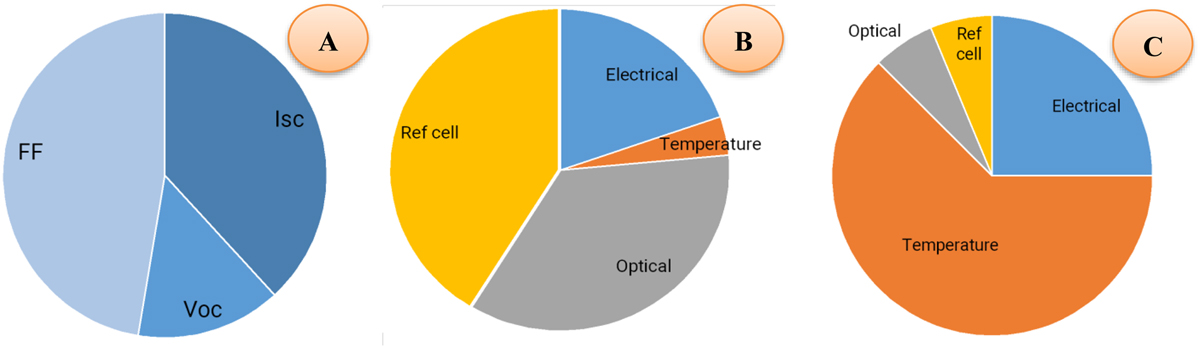
Contributions to the final uncertainty of Pmax for a typical indoor measurement at 1000 W/m2 and 25 °C. (A): share of the three terms constituting the Pmax uncertainty; (B): exploded diagram with the Isc components; (C): exploded diagram with the Voc components.
Current usage metrics show cumulative count of Article Views (full-text article views including HTML views, PDF and ePub downloads, according to the available data) and Abstracts Views on Vision4Press platform.
Data correspond to usage on the plateform after 2015. The current usage metrics is available 48-96 hours after online publication and is updated daily on week days.
Initial download of the metrics may take a while.