Fig. 9
Download original image
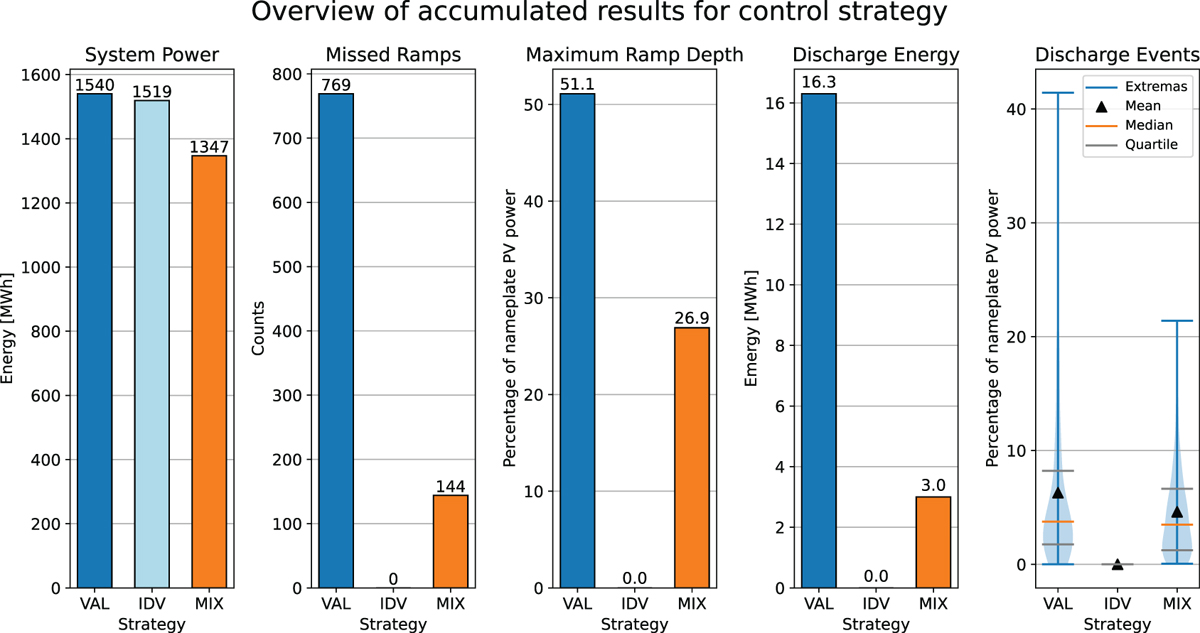
Performance overview control strategy with strategy MIX in orange, and as reference IDV in light blue and VAL in blue for the 18-day dataset. The first plot shows the respective energy yield. The second and third plots describe the number of ramps and the maximum ramp depth of the missed ramps. Plot four displays the required discharge power of the battery.
Current usage metrics show cumulative count of Article Views (full-text article views including HTML views, PDF and ePub downloads, according to the available data) and Abstracts Views on Vision4Press platform.
Data correspond to usage on the plateform after 2015. The current usage metrics is available 48-96 hours after online publication and is updated daily on week days.
Initial download of the metrics may take a while.