Fig. 10
Download original image
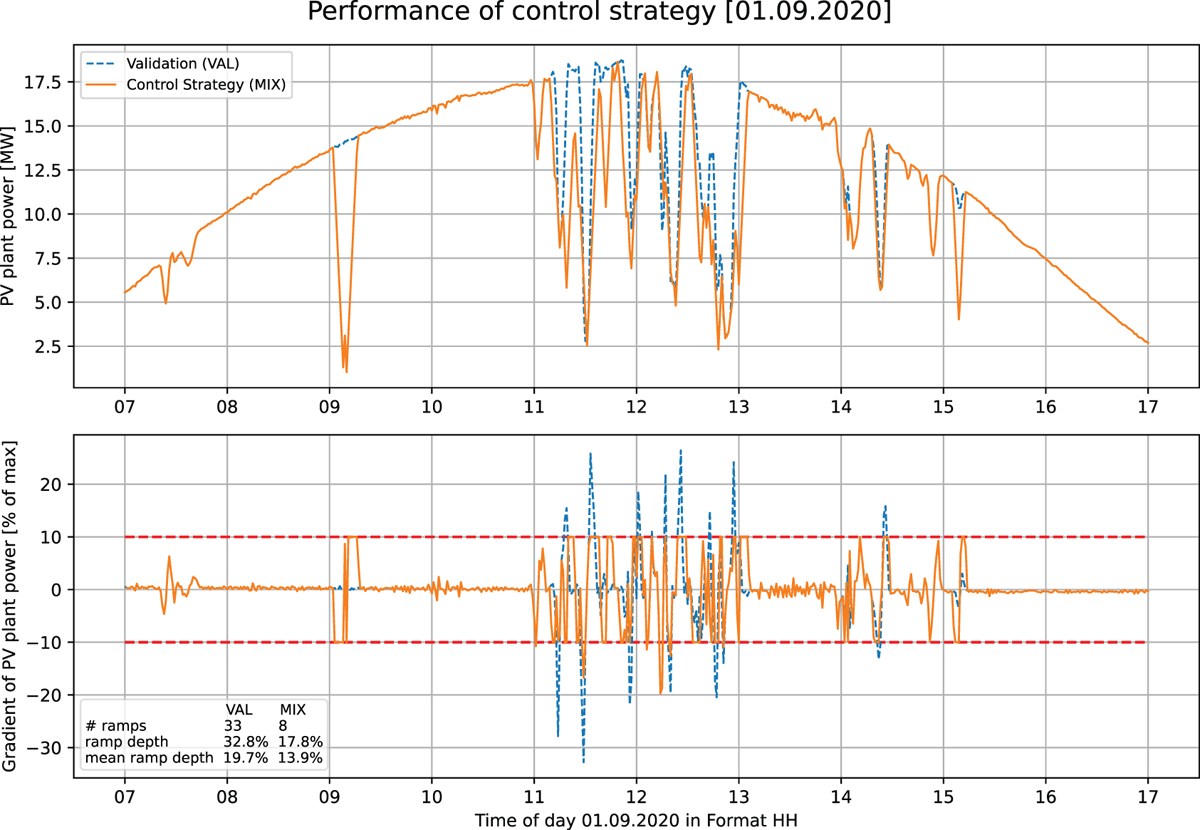
Output power and its power gradient of the strategies VAL and MIX without battery power for 01.09.2020. The two red dashed lines represent the ramp rate constraint of 10%/min. The text box in the lower left section shows the respective number of remaining ramps, the average, and maximum ramp depth.
Current usage metrics show cumulative count of Article Views (full-text article views including HTML views, PDF and ePub downloads, according to the available data) and Abstracts Views on Vision4Press platform.
Data correspond to usage on the plateform after 2015. The current usage metrics is available 48-96 hours after online publication and is updated daily on week days.
Initial download of the metrics may take a while.