Fig. 8
Download original image
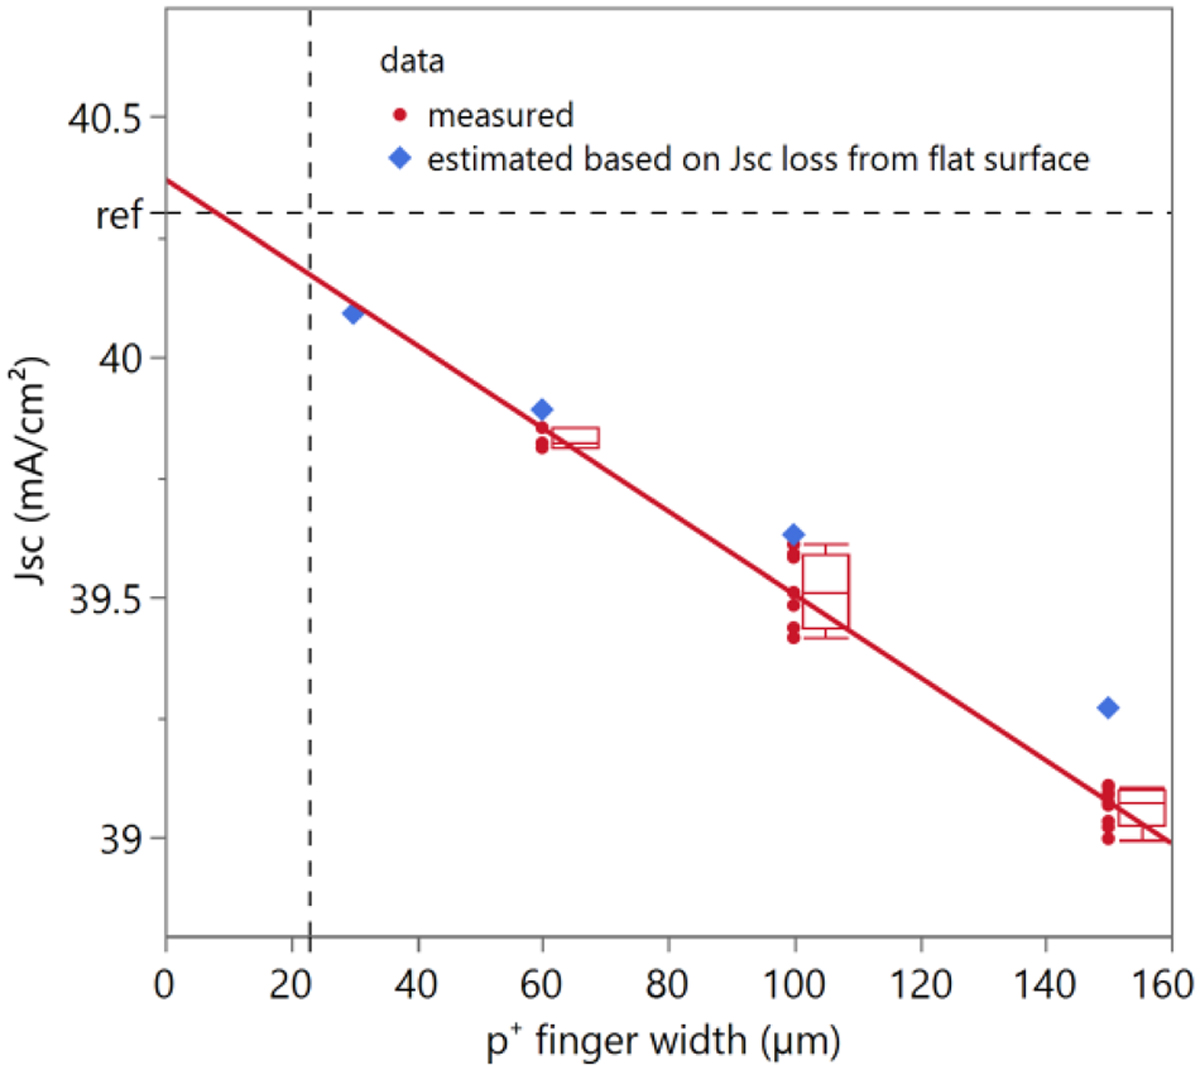
Measured Jsc as a function of p+ poly-Si finger width and a linear fit to the data. The horizontal dashed line indicates the current of the TOPCon reference group (G1). The point markers show the individual measurement points and the box plots indicate the median value, the 25% and 75% quantiles and the minimum and maximum of the distribution. Additionally, an estimated value for Jsc is shown. This estimate only takes into account the expected current loss arising from the flat surface of the p+ poly-Si fingers but not the absorption within the p+ poly-Si itself.
Current usage metrics show cumulative count of Article Views (full-text article views including HTML views, PDF and ePub downloads, according to the available data) and Abstracts Views on Vision4Press platform.
Data correspond to usage on the plateform after 2015. The current usage metrics is available 48-96 hours after online publication and is updated daily on week days.
Initial download of the metrics may take a while.