Fig. 4
Download original image
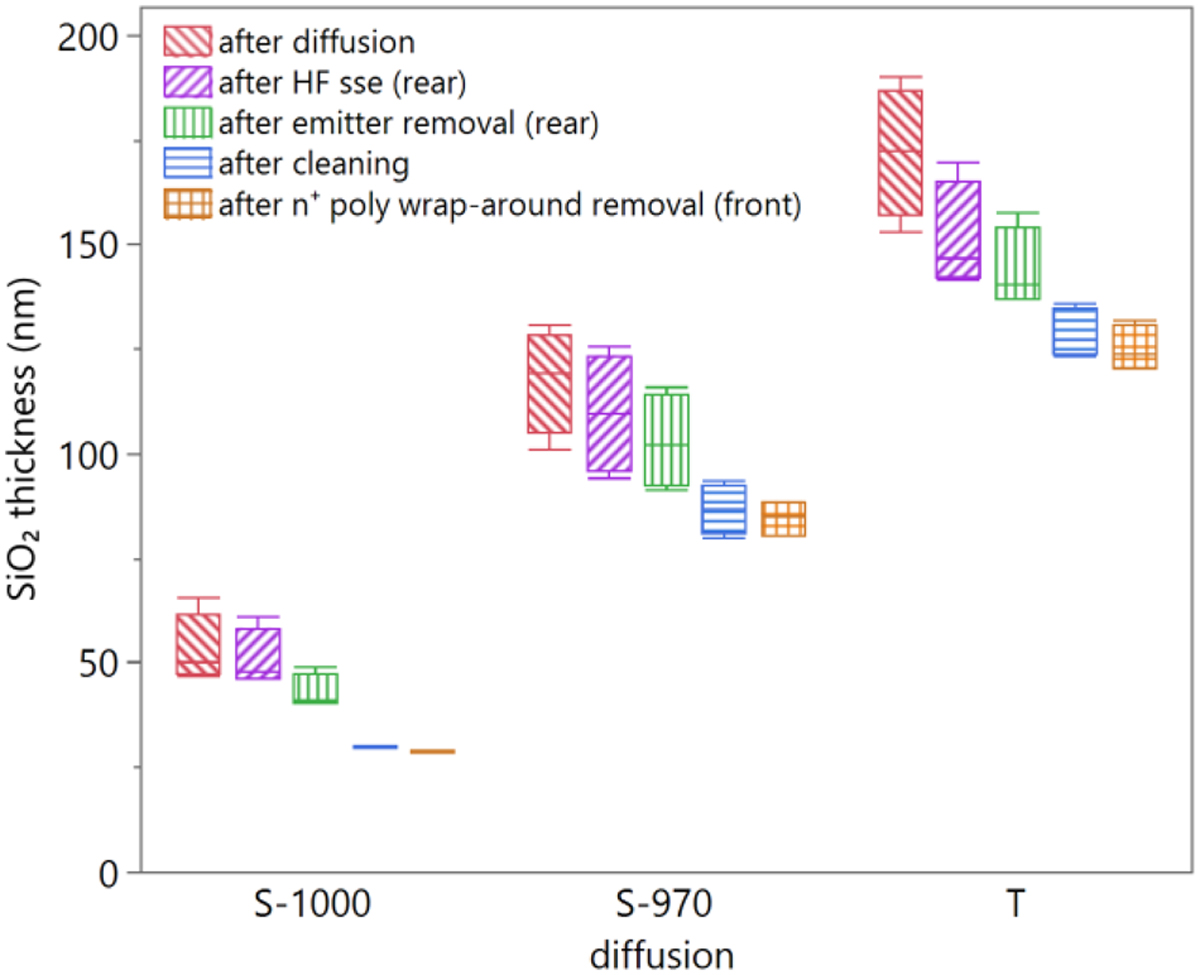
SiO2 thickness on flat p+ poly-Si for different diffusions after various process steps, as measured on each four fiducial marks close to the wafer edge. The box plots indicate the median value, the 25% and 75% quantiles and the minimum and maximum of the distribution. Each distribution contains four measurement points which are omitted to reduce clutter.
Current usage metrics show cumulative count of Article Views (full-text article views including HTML views, PDF and ePub downloads, according to the available data) and Abstracts Views on Vision4Press platform.
Data correspond to usage on the plateform after 2015. The current usage metrics is available 48-96 hours after online publication and is updated daily on week days.
Initial download of the metrics may take a while.