Fig. 9
Download original image
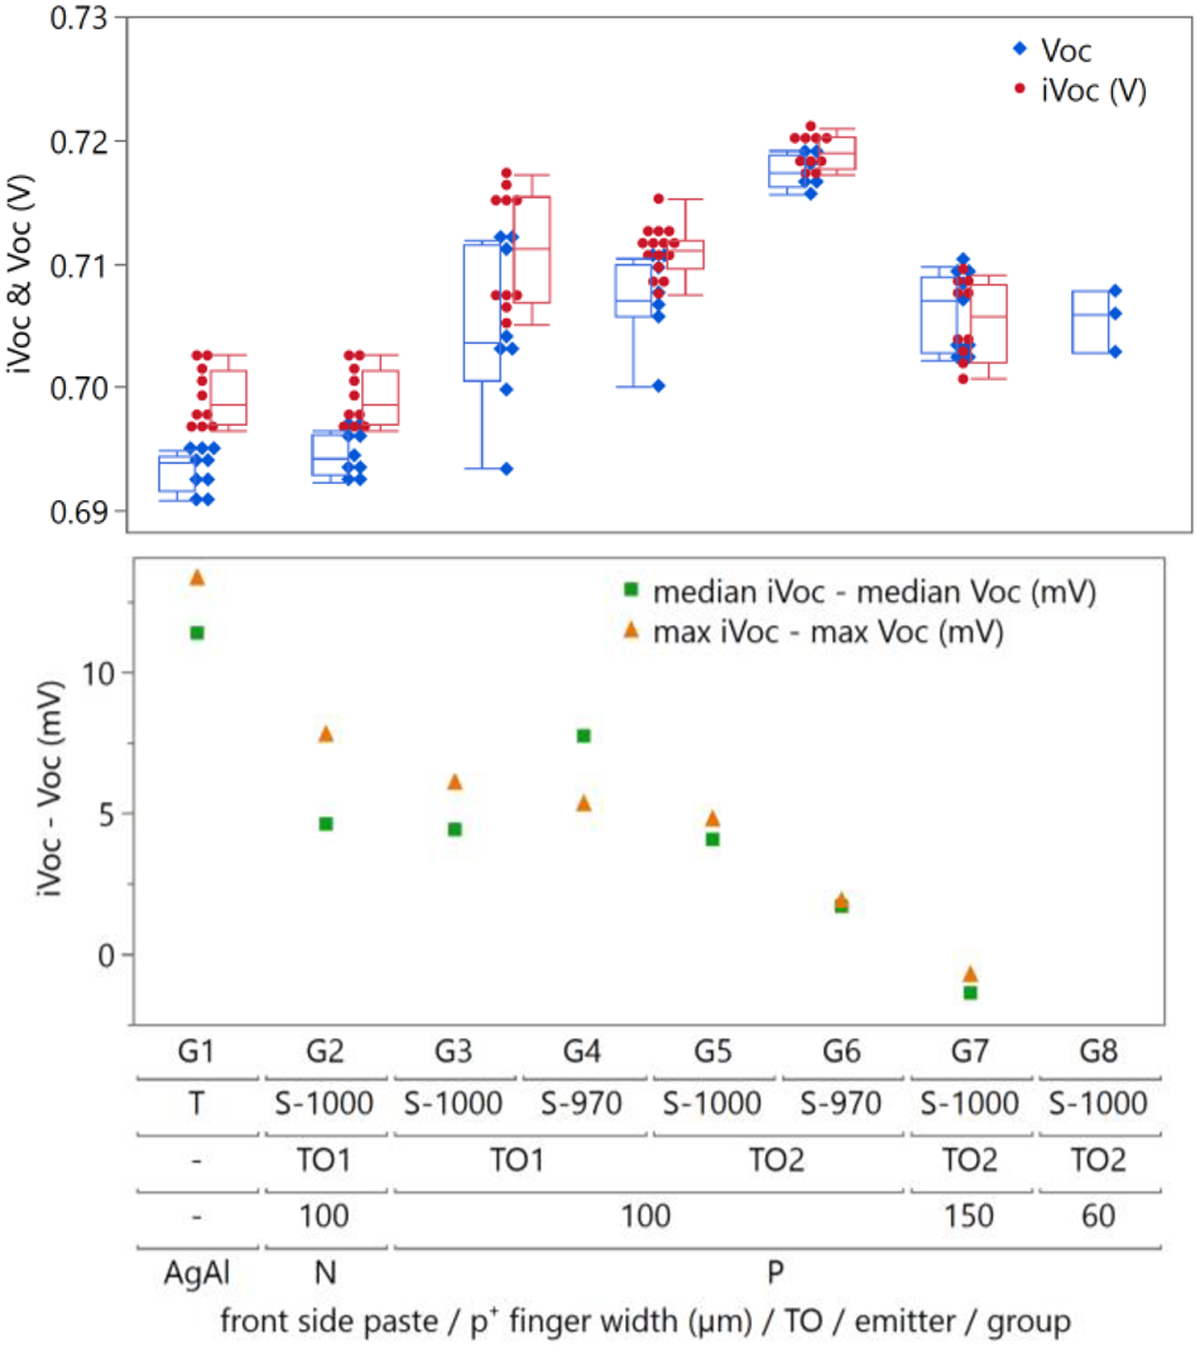
Comparison of iVoc, Voc and derived iVoc-to-Voc loss based on the median (green) and maximum (orange) observed for the two distributions for the TOPCon reference group (G1) and various SelFi TOPCon groups (G2-G7). The point markers show the individual measurement points and the box plots indicate the median value, the 25% and 75% quantiles and the minimum and maximum of the distribution.
Current usage metrics show cumulative count of Article Views (full-text article views including HTML views, PDF and ePub downloads, according to the available data) and Abstracts Views on Vision4Press platform.
Data correspond to usage on the plateform after 2015. The current usage metrics is available 48-96 hours after online publication and is updated daily on week days.
Initial download of the metrics may take a while.